
Figure 5.
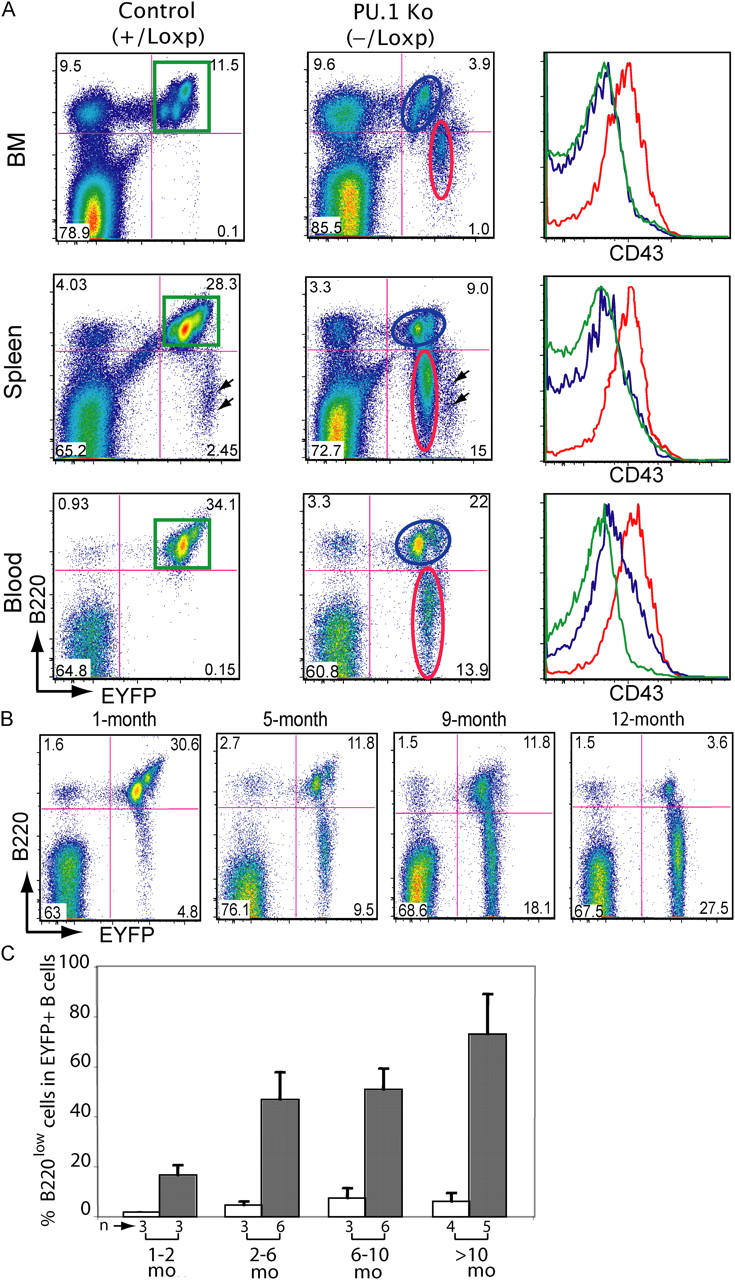
B cells with an altered phenotype can be detected in conditional PU.1 knockout mice and increase with the age. (A) FACS plots of the bone marrow, spleen, and blood leukocytes in a control and a conditional knockout mouse at 6 mo old. The plots show B220 versus EYFP expression. Arrows indicate the EYFPbright plasma cells in the control and the knockout spleen. Histograms show levels of CD43 expression of EYFP+ cells within the gates indicated in green for B220+ control cells; in blue for B220+ knockout cells; and in red for B220low knockout cells. (B) FACS plots of the peripheral blood of PU.1 knockout mouse 25 at 1, 5, 9, and 12 mo old. (C) Histogram summarizing the proportion of B220lowEYFP+ cells in EYFP+ B cell population within the peripheral blood in control (white bars) and knockout mice (black bars) at different age. Error bars represent means ± standard deviations. The numbers of mice analyzed are indicated.