
Figure 4.
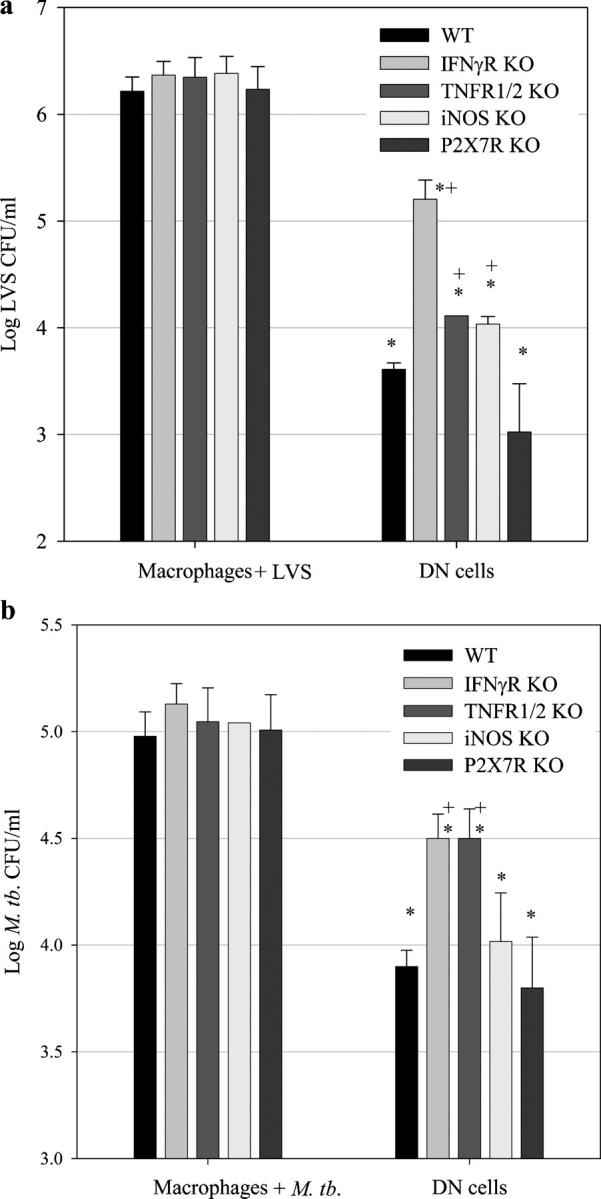
LVS or M. tb.–immune DN T cells control the intracellular growth of F. tularensis LVS and M. tb. in part by production of IFN-γ and TNF-α. BMMØs from WT mice, IFN-γR KO mice, TNFR 1/2 KO mice, iNOS KO mice, or P2X7R KO mice (as indicated by the respective shaded bars) were infected with LVS at an MOI of 1:20 (bacterium/macrophage) or with M. tb. at an MOI of 1:100. The indicated infected BMMØs were co-cultured with highly enriched WT DN T cells (prepared as described in Materials and methods) from LVS-immune spleens (a), M. tb.–immune spleens (b), or no spleen cells (a, BMMØ + LVS and b, BMMØ + M. tb.). 3 d (LVS) or 8 d (M. tb.) after infection, BMMØs were washed, lysed, and plated to determine the levels of intracellular bacteria. Values shown are the mean numbers of CFU/ml ± the SEM of viable bacteria (triplicate samples). LVS uptake by the different BMMØ monolayers at time 0 was as follows: log10 1.401 ± 0.174 CFU/ml (WT), log10 1.492 ± 0.199 CFU/ml (IFN-γR KO), log10 1.46 ± 0.151 CFU/ml (TNFR 1/2 KO), log10 1.360 ± 0.102 CFU/ml (iNOS KO), and log10 1.360 ± 0.318 CFU/ml (P2X7R KO). M. tb. uptake for the different BMMØ monolayers at time 0 was as follows: log10 3.367 ± 0.096 CFU/ml (WT), log10 3.390 ± 0.154 CFU/ml (IFN-γR KO), log10 3.284 ± 0.255 CFU/ml (TNFR 1/2 KO), log10 3.340 ± 0.297 CFU/ml (iNOS KO), and log10 3.465 ± 0.061 CFU/ml (P2X7R KO). In all cases, bacterial uptake in the KO BMMØs was not significantly different from their WT counterparts (P > 0.20). These data are representative of three (a and b) experiments of similar design. *, P < 0.05 compared with co-cultures containing macrophages + LVS; +, P < 0.05 compared with co-cultures containing DN T cells and WT BMMØs.