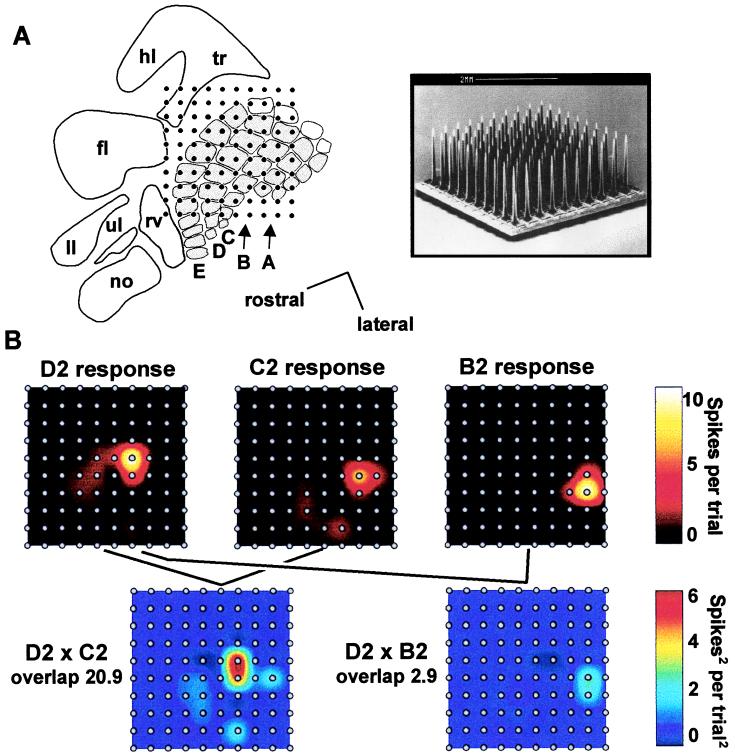
Figure 3.
Physiological experiment. (A) (Left) Cortical position of the microelectrode array in a typical experiment. no, nose; ll, lower lip; ul, upper lip; tr, trunk; hl, hindlimb; fl, forelimb; rv, rostral vibrissae. Barrel rows A–E are indicated; caudal barrels (α, β, γ, δ) are white. (Right) Scanning electron micrograph of 10 × 10 electrode array (courtesy of Bionic Technologies). Scale in both figures is given by the interelectrode distance, 400 μm. (B) (Upper plots) Cortical activity maps for three whiskers. Interpolation was performed between the response values at each electrode. (Lower plots) Overlap between two pairs of activity maps.

