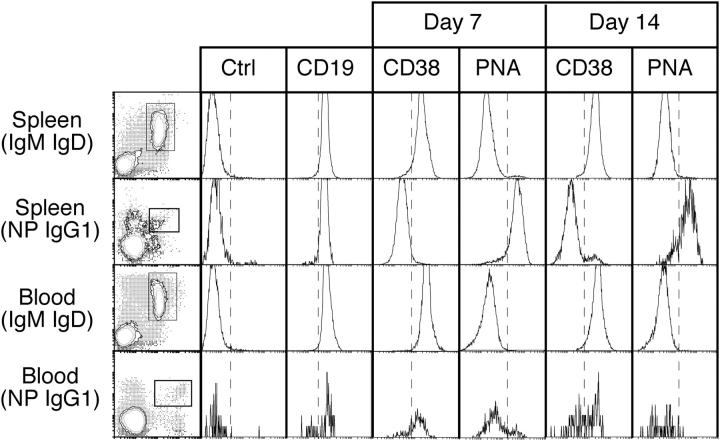
Figure 2.
The cell surface phenotype of B220+ NP-binding IgG1+ cells in blood and spleen 7 and 14 d after immunization. B220+ cells were purified mechanically from spleen and blood and stained for surface IgM, IgD, IgG1, and NP. The stains of spleen and blood (IgM, IgD)+ B cells shown in the left column depict before separation, whereas those of NP+IgG1+ B cells depict after separation. Boxed areas indicate the cells analyzed for the parameters depicted by the histograms. The fourth parameter in these analyses is indicated above each column. The dashed line provides a point of reference for comparing samples. The cells were recovered from tissues pooled from two to four mice, and these data are representative of three separate experiments. Ctrl, isotype control antibody.

