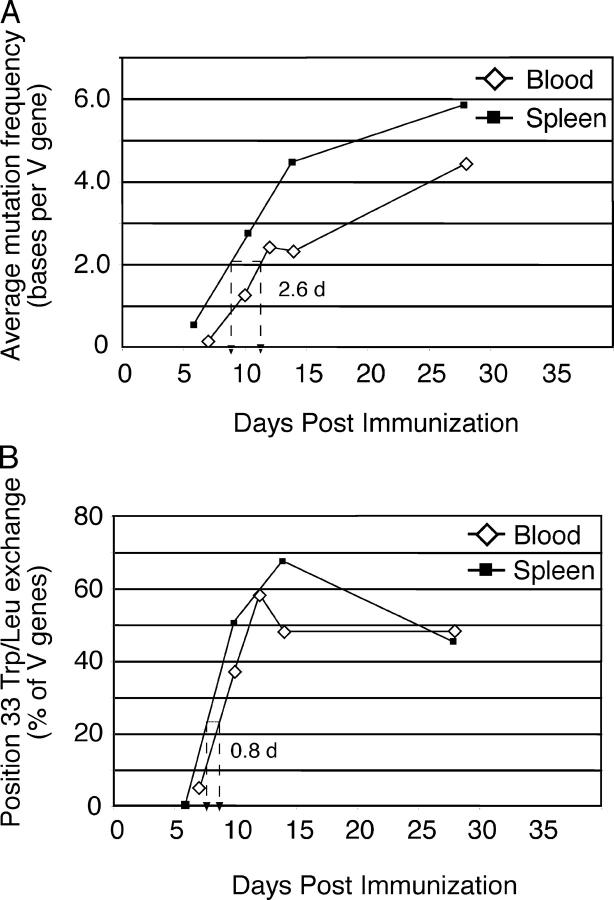
Figure 3.
Evidence for somatic mutation and affinity maturation in blood NP+IgG1+ B cells. Single NP-binding IgG1+ B cells were isolated from blood and spleen at the indicated times (for details, see Table I). Analysis of those VH-Cγ1 rearrangements using VH186.2 provided the values depicted in this figure. (A) The average mutation frequency of VH genes at the indicated times is plotted against the time after immunization. The dashed line indicates the time difference between the two populations required to reach an average of 2.0 mutations per VH gene. Accumulation of mutations in blood cells is delayed by ∼2.5 d compared with spleen. (B) The proportion of VH sequences in blood and spleen NP-specific IgG1+ B cells containing a position 33 Y → L exchange as a function of time. Unlike the mutation frequency, cells bearing affinity-enhancing mutations are almost as common in blood as in spleen at each time point. In both plots, spleen values use square symbols, whereas blood uses diamonds. Cells were recovered from tissues pooled from ≥6 mice at each time point.

