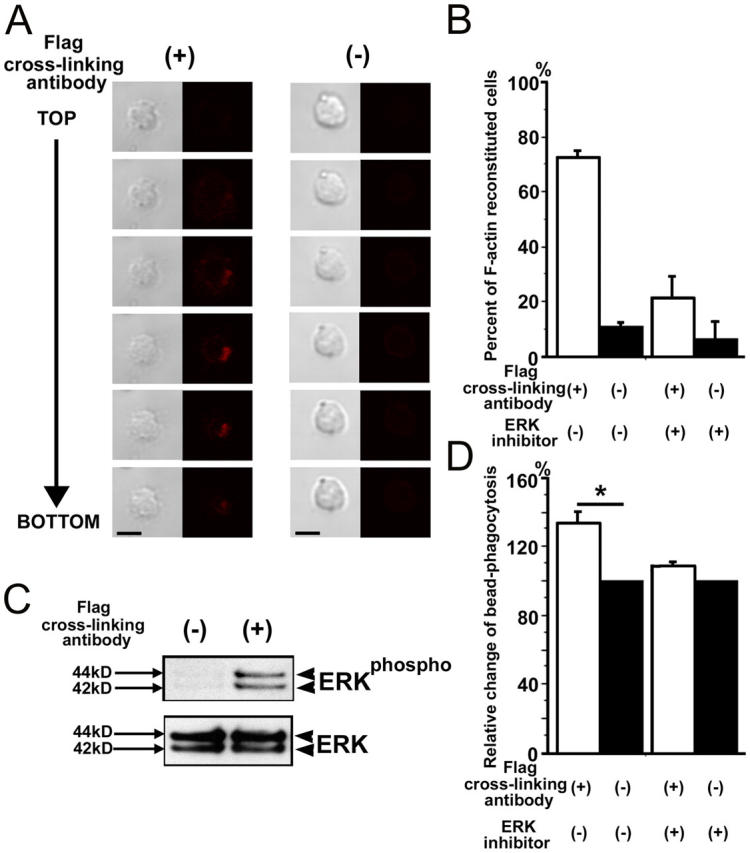
Figure 5.

Cytoskeleton reorganization and ERK signaling after stimulation of microglial phagocytosis by TREM2 cross-linking. (A) Primary murine microglia were transduced with fTREM2 vector. Microglia were cultured on dishes coated with antibodies directed against the Flag epitope (+) to cross-link the fTREM2 or control antibodies (−) for 1 h. Microglia were fixed and then stained with Alexa Fluor 546–conjugated phalloidin. Individual microglial cells were scanned by a confocal microscope from top (TOP) to bottom (BOTTOM) with a step of 1.6 μm between each optical section. Strong F-actin staining was observed at the bottom of the cells after TREM2 stimulation. Phase contrast and confocal images are shown. Bars, 10 μm. (B) Cytoskeleton reorganization of F-actin was quantified by counting the number of cells showing F-actin at the bottom of the cells. Data are presented as mean ± SEM. (C) Western blot analysis of protein lysates of primary microglial cells. Phosphorylated ERK was detected after blotting with a specific antibody directed against phosphorylated ERK in fTREM2-transfected cells after stimulation with a cross-linking antibody (+), but not the control antibody (−). The total protein amount of ERK was detected after reblotting with an antibody directed against total ERK. (D) Increased bead phagocytosis after fTREM2 stimulation is neutralized by ERK inhibitor. The relative change in bead phagocytosis after fTREM2 stimulation was compared between the stimulated (open bars) and nonstimulated (closed bars) situation by flow cytometry. Microglia were transduced with fTREM2 vector and treated with or without ERK inhibitor. ERK inhibitor reverted the increase of phagocytosis stimulated by TREM2. Data are presented as mean ± SEM of at least three independent experiments. *, P < 0.05; Mann-Whitney U test.
