Figure 3.
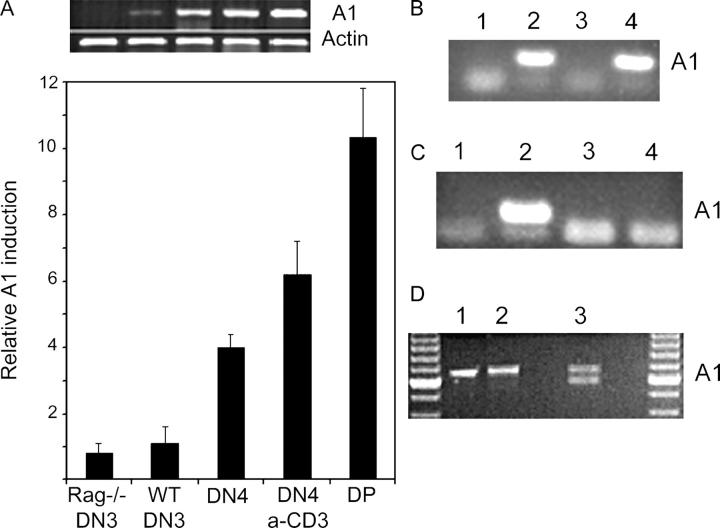
Pre-TCR signaling induces A1 expression both in vivo and in vitro. (A) Semiquantitative and real-time RT-PCR analysis of A1 expression in ex vivo thymocyte subsets. (B) Semiquantitative PCR analysis of A1 expression in pre-TCR+ (lane 2, SCB29; lane 4, LR2-WTpTα) and pre-TCR− (lane 1, SCIET27; lane 3, LR2) cell lines. (C) Pre-TCR complexes containing truncated pTα chains fail to induce A1 expression. Semiquantitative PCR-quantitated A1 expression in LR2 cells expressing (lane 1) no pTα chain, (lane 2) a WT pTα chain, (lane 3) a pTα chain lacking its entire cytoplasmic domain, or (lane 4) a pTα chain lacking its proline-rich domains. (D) Isoform-specific pattern of A1 expression in DN4 pre–T cells. A1 cDNA amplified from DN thymocytes (using A1XhoUp1 and A1BamLow1 primers) was left nondigested (lane 1), digested with NsiI (lane 2), or digested with BglII (3).

