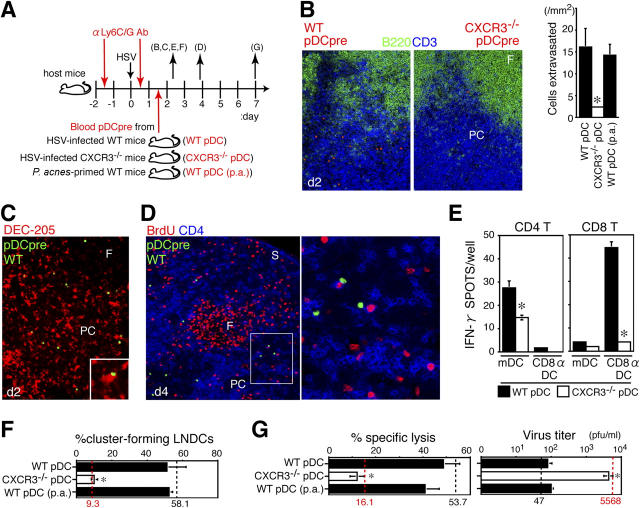
Figure 5.
Reconstitution of pDC-depleted mice with pDC precursors restores CTL induction. (A) Donor precursor cells isolated from the peripheral blood of HSV-infected WT mice (WT pDC), HSV-infected CXCR3-deficient mice (CXCR3−/− pDC), and P. acnes–primed WT mice (WT pDC [p.a.]) on day 2 were labeled with fluorescence dyes and adoptively transferred into HSV-infected, anti-Ly6G/C Ab–treated mice. LNDCs were isolated from reconstituted mice on day 2 of infection, and LN CD8+ T cells were isolated from reconstituted mice on day 7 of infection, for functional tests. The letters in parentheses correspond to panels in the figure. (B) Effective recruitment of WT, but not CXCR3−/−, pDC precursors on day 2 of infection. (left and middle) Entry of CMTMR-labeled pDC precursors (orange) in the T cell zone (blue, CD3; green, B220) of PLN 2 h after cell transfer. Magnification, 200. (right) The number of transferred pDCs observed in the T cell zone of PLN on day 2 of infection. Representative data from three independent experiments are presented as the mean ± SD (n = 3 for 15-mm2 sections). *, P < 0.05 by the Student's t test, comparing WT with CXCR3−/− pDCs. (C) CFSE-labeled WT pDC precursors (green) in contact with DEC-205+ (red) LNDCs in the T cell zone of PLN 2 h after cell transfer (day 2 of infection) at a magnification of 200. The inset shows a higher magnification (400). (D) CFSE-labeled WT pDC precursors in contact with BrdU+ (red) and CD4+ (blue) T cells of PLN 48 h after cell transfer (day 4 of infection) at a magnification of 200. A higher magnification is indicated by the box (400). F, follicle; PC, paracortex; S, sinus. (E) The number of IFN-γ+ spots produced by PLN CD4+ or CD8+ T cells (106 cells/well) from HSV-infected mice on day 2, after 16 h of incubation with LNDCs with no in vitro restimulation. LNDCs (mDCs or CD8α+ DCs; 105 cells/well) were obtained from anti-Ly6G/C mAb–treated mice reconstituted with WT pDC or CXCR3−/− pDCs on day 2. DCs alone produced no spots. (F) The percentage of cluster-forming LNDCs obtained from anti-Ly6G/C mAb–treated mice reconstituted with WT pDC, CXCR3−/− pDC, or WT pDC (p.a.) on day 2. Freshly isolated LNDCs were incubated with LN CD3+ T cells from HSV-infected mice for 2 h. (G) Specific lysis in vitro of PLN CD8+ T cells and virus titers of PLNs obtained from pDC-depleted mice reconstituted with WT pDCs, CXCR3−/− pDCs, or WT pDCs (p.a.) on day 7. Values for mice treated with control Ab (black dashed lines) and anti-Ly6G/C Ab (red dashed lines) on days 2 (F) and 7 (G) of infection are also shown to compare reconstituted mice with nonreconstituted mice as described in Figs. 3, G and H and Fig. 4 B. Representative data from three independent experiments are presented as the mean ± SD (n = 3). *, P < 0.05 by Student's t test, comparing WT with CXCR3−/− pDCs.

