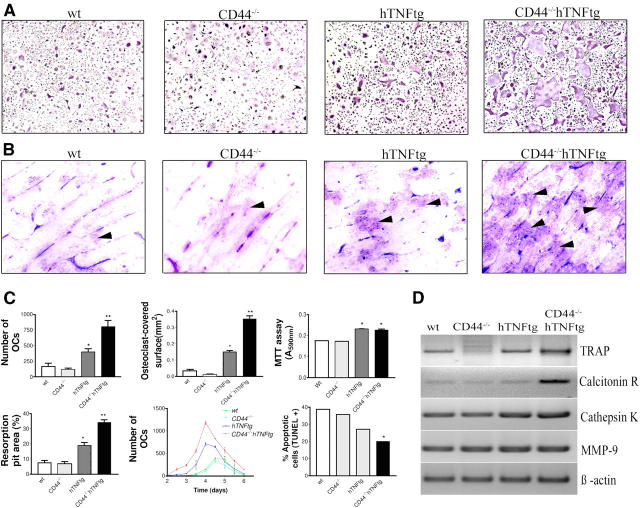
Figure 5.
Ex vivo analysis of osteoclast formation. (A) Formation of TRAP+ cells in the presence of M-CSF and RANKL in spleen cells from WT, CD44−/−, hTNFtg, and CD44−/− hTNFtg mice. (B) Bone resorption assay showing formation of resorption pits (arrowheads). Original magnification of 100. (C) Quantitative analysis of number, size, and resorptive capacity of osteoclasts and time response curve of osteoclastogenesis. Apoptosis rate (TUNEL assay) and proliferation rate (MTT assay) of osteoclasts. Data are mean ± SD. Asterisks indicate significant (P < 0.05) difference. (D) RT-PCR for osteoclast markers from total RNA of cultivated osteoclasts of WT, CD44−/−, hTNFtg, and CD44−/− hTNFtg mice.

