Figure 4.
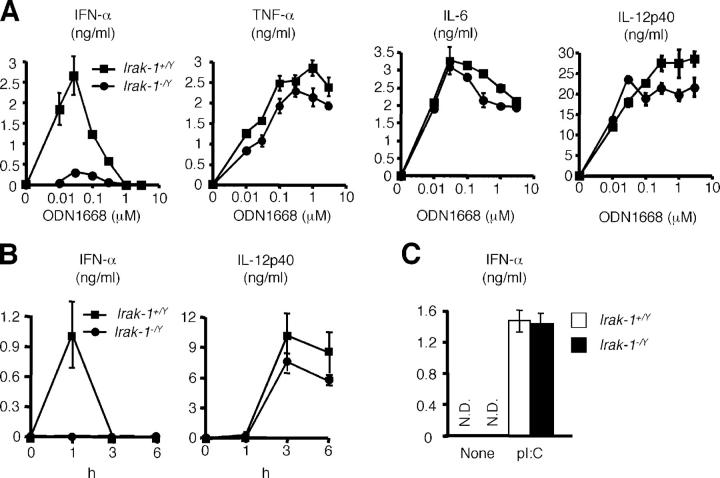
IFN-α induction by other TLR ligands in Irak-1 −/Y mice. (A) Flt3L–BMDCs from Irak-1 + /Y and Irak-1 − /Y mice were stimulated with the indicated concentration of ODN1668 for 24 h. Concentration of IFN-α, TNF-α, IL-6, and IL-12p40 in the culture supernatants was measured by ELISA. Data are shown as the mean ± SD. (B) Irak-1 + /Y and Irak-1 − /Y mice (n = 3) were intravenously injected with 50 nmol of R-848. Samples of sera were taken and the concentrations of IFN-α and IL-12p40 were determined by ELISA. (C) Flt3L–BMDCs from Irak-1 + /Y and Irak-1 − /Y mice were transfected with 10 μg/ml poly(I/C) for 24 h. Concentration of IFN-α in the culture supernatants was measured by ELISA. Data are shown as the mean ± SD. N.D., not detected.

