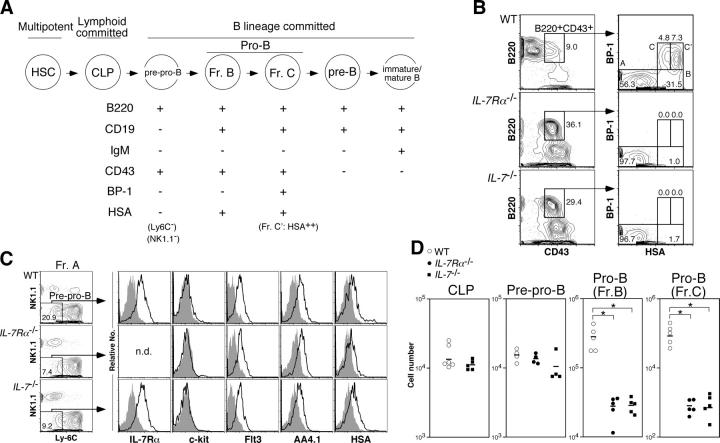
Figure 1.
B cell development is arrested at the pre–pro-B stage in the absence of IL-7R signaling. (A) Schematic maturational relationship of B cell populations used in this study. We excluded Ly-6C+ and NK1.1+ cells from Hardy's fraction A (reference 25) except for the experiments shown in Fig. 4. CD19 can be used instead of HSA to distinguish pre–pro-B (fraction A) and pro-B (fractions B and C/C′) cells (reference 13; Fig. S1 D, available at http://www.jem.org/cgi/content/full/jem.20050158/DC1). Hereafter, we used the fraction C/C′ population as fraction C. (B) Bone marrow (BM) cells from 8-wk-old mice were stained with antibodies for lineage markers (Lin: CD3ɛ, Gr-1, Ter119, and Mac-1), B220, CD43, BP-1, and HSA. Propidium iodide+ dead cells as well as Lin+ cells were excluded from this cell surface phenotyping. The numbers in FACS plots are percentages of cells in each cell population for each plot. The representative results of at least three independent experiments are shown. (C) The expression of IL-7Rα, c-Kit, Flt3, AA4.1, and HSA in pre–pro-B cells derived from WT, IL-7Rα−/−, and IL-7 −/− mice. The definition of pre–pro-B cells here is Lin−B220+CD43+CD19−NK1.1−Ly-6C− cells. Removal of CD19+ cells from this analysis is critical to exclude the more mature B cell progenitors from the pre–pro-B cell population (see Fig. S1). Open and filled histograms represent the expression level of various markers and the negative control stained with isotype-matched irrelevant antibodies, respectively. We did not stain pre–pro-B cells from IL-7Rα−/− mice with anti–IL-7Rα antibodies in this analysis. (D) The number of CLP, pre–pro-B, and pro-B cells in bone marrow from bilateral femurs and tibiae derived from WT (open circle), IL-7Rα−/− (closed circle), and IL-7 −/− (closed square) mice. The absolute number of cells was calculated with total bone marrow cell numbers and the percentage of each cell population. The mean is indicated as a horizontal bar. Because IL-7Rα is a marker to define CLPs, we did not determine the number of CLPs in IL-7Rα−/− mice. Asterisks denote significant difference by Student's t test; P < 0.05.

