Figure 2.
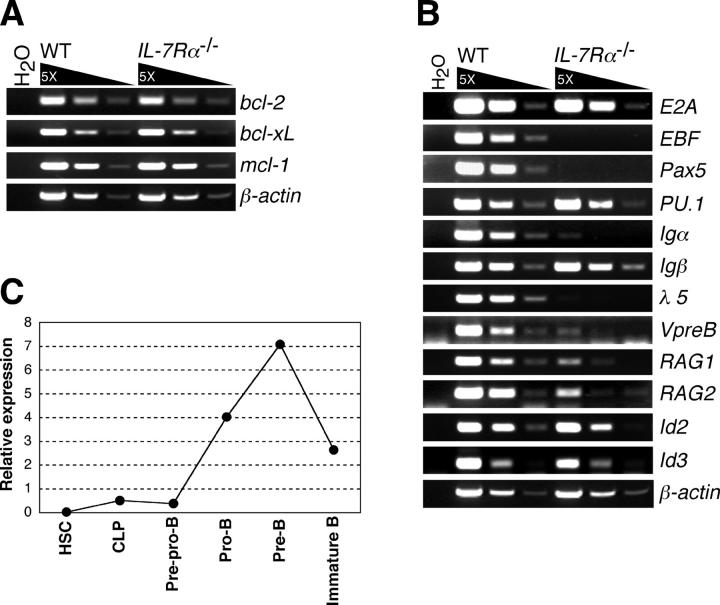
Gene expression profiles in IL-7R α −/− pre–pro-B cells. (A) Expression of antiapoptotic genes in WT and IL-7Rα−/− pre–pro-B cells were examined by RT-PCR. RNA was purified from 1.5 × 10⁴ pre–pro-B cells (Lin−B220+CD43+CD19−NK1.1−Ly-6C− cells), which were sorted twice in sequence (double sorted) from WT and IL-7Rα−/− BM cells. After double sorting, the purity of cells was >99% in reanalysis. (B) Expression of genes that are involved in B cell development in WT and IL-7Rα−/− pre–pro-B cells. RT-PCR analyses were done as in A. (C) Expression of EBF gene in various developing B cell populations. The cell populations used here are HSC (Lin−/lowThy-1.1lowc-KithighSca-I+), CLP (Lin−c-KitlowSca-IlowThy-1.1−IL-7Rα+), pre–pro-B (B220+CD43+CD19−NK1.1−Ly-6C−), pro-B (B220+CD43+CD19+HSAhigh), pre-B (B220+CD43−IgM−), and immature B (B220+IgM+IgD−). The lineage cocktail (Lin) used for HSCs and CLPs also contained anti-B220 antibodies. Total RNA was purified from each doubly sorted population and subjected to quantification of EBF mRNAs by real-time PCR after first strand synthesis with reverse transcriptase. The amount of the first strand DNA applied was normalized to the expression level of a reference gene, GAPDH. EBF expression in whole BM was arbitrarily defined as unit one. The mean value of more than three independent samples is shown. Range of error is too small to be displayed in the histogram.

