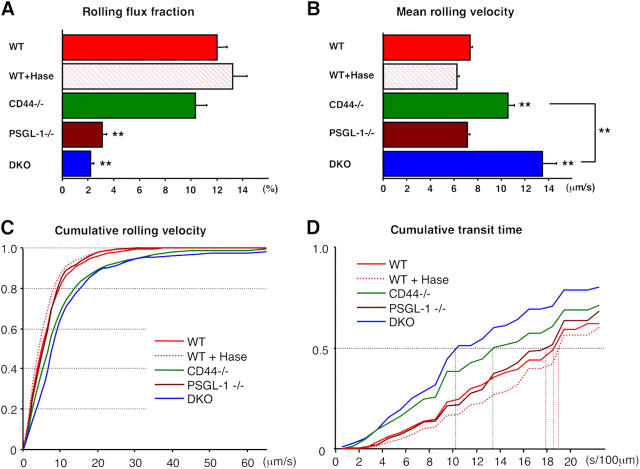
Figure 2.
Intravital microscopy of TNF-α–stimulated cremaster muscle venules. Leukocyte behavior in cremasteric venules was recorded between 150 and 210 min after TNF-α administration for off-line analyses. (A) Rolling flux fraction in wild-type (WT, n = 63 venules), WT treated with hyaluronidase (WT + Hase, n = 51), CD44−/− (n = 79), PSGL-1−/− (n = 50), and DKO (n= 59) mice. (B–D) The velocity of 2,610 rolling leukocytes from the five groups of mice was measured over 2 s (also see Fig. S4). (B) Mean rolling velocities. (C) Cumulative histograms of rolling velocities. (D) Cumulative histograms of transit times calculated per 100 μm of venule segment. Five-group comparisons were analyzed by one-way ANOVA with Bonferroni/Dunn post hoc test. **, P < 0.001 (1% risk level) compared with WT group or between indicated two groups.

