Figure 8.
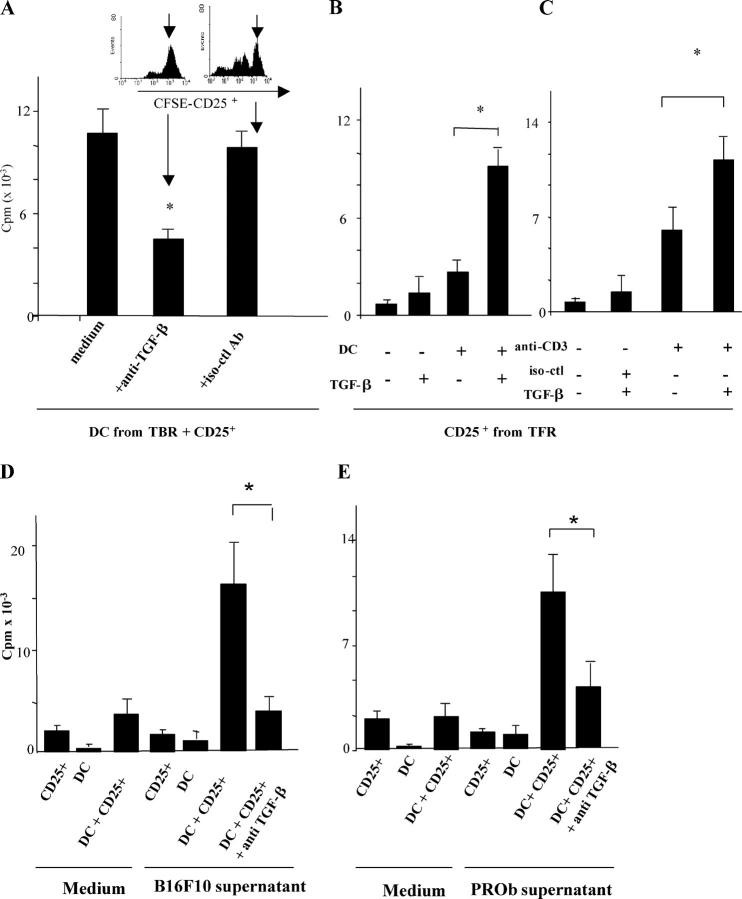
IMDCs stimulate T reg cell proliferation in a TGF-β–dependent fashion. (A) Neutralization of TGF-β curtails IMDC-driven T reg cell proliferation. 105 IMDCs were cultured for 5 d with T reg cells at a 1:1 ratio along with 1 ng/ml blocking anti–TGF-β antibody or an isotype-matched control before pulsing with [3H]thymidine. Both IMDCs and T reg cells were isolated from the spleen of TBR. The inset shows a similar experiment in which CD25+ splenic cells were labeled with CFSE, and CFSE expression in T cells was monitored by flow cytometry at day 5 (one representative of three experiments is shown). Values represent the mean ± SEM. The asterisk indicates statistical significance (P = 0.03). (B) Exogenous TGF-β cooperates with IMDCs from TFM to drive the proliferation of T reg cells. 105 splenic T reg cells from TBR were cultured in FBS-free medium supplemented with 200 UI/ml rIL-2 along with CD11b+ splenic DCs from tumor-free rats at a 1:1 ratio (left) in the presence of 1 ng/ml TGF-β1 before pulsing with [3H]thymidine. One representative out of five experiments is shown. Means and SEM of cpm of triplicate wells are shown. In all proliferation assays, CD11b+ DCs alone did not incorporate [3H]thymidine above background levels (not depicted). The asterisk indicates statistical significance (P < 0.05) using Fisher's exact test. (C) Stimulation of T reg cell proliferation by anti-CD3 and TGF-β1. T reg cells were stimulated with immobilized anti-CD3 and/or TGF-β1 (as in B). (D and E) In vitro cooperation between tumor cell supernatants and IMDCs to drive TGF-β–dependent T reg cell proliferation in mice (D) and in rats (E). 2 × 10⁴ IMDCs isolated from tumor-free rodents and incubated in tumor cell supernatants for 24 h were co-cultured with 105 T reg cells from tumor-bearing rodents with anti–TGF-β1 blocking antibodies for 5 d. Proliferation of T reg cells was monitored in triplicate wells by measuring [3H]thymidine incorporation. One representative experiment out of three is depicted. The asterisk indicates statistical significance (P < 0.05) using Fisher's exact test. It is noteworthy that supernatants of NIH 3T3 did not license DCs for T reg cell proliferation (not depicted).

