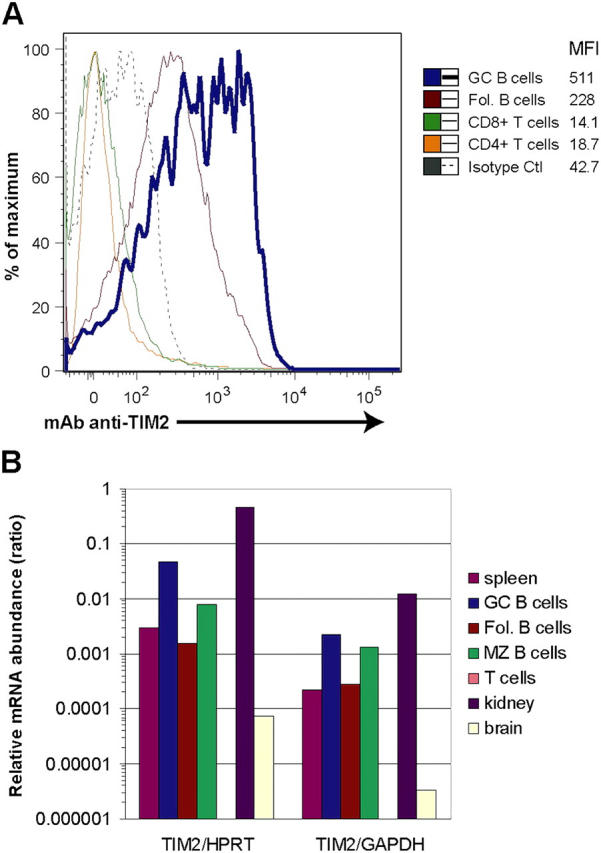
Figure 1.

TIM-2 is expressed preferentially on GC B cells. (A) Flow cytometric analysis of TIM-2 expression on mouse spleen cells. Spleens were isolated 8 d after immunization with SRBCs. Each curve is normalized, so that the peaks are of equal height. Staining of GC cells is more than twice that of follicular B cells (Fol. B cells), although all B cells stain with anti–TIM-2, compared with an isotype control mAb (dotted line; the control shown is for GC B cells, but equivalent staining was seen with control staining of follicular B cells, not depicted). TIM-2 was not detected on CD4+ or CD8+ T cells. The numbers indicate geometric mean fluorescence intensity (MFI) for TIM-2 staining of each cell subset. (B) Quantitative RT-PCR analysis of TIM-2 expression. Total RNA was prepared from isolated subsets of spleen cells (sorted by FACS) or from isolated tissues, and was analyzed by quantitative RT-PCR. Expression of mRNA is shown as a ratio of TIM-2 mRNA/mRNA of two housekeeping genes, hypoxanthine-guanine phosphoribosyltransferase (HPRT) and GAPDH. Fol, follicular; MZ, marginal zone.
