Figure 1.
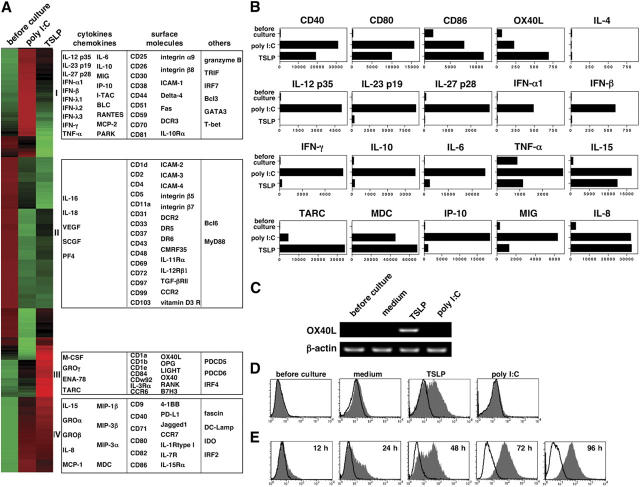
TSLP-DCs express OX40L. (A) Each column represents data from human blood CD11c+ immature mDCs either resting or activated by poly I:C or TSLP. The selected 2,166 genes were grouped, based on similarity in expression patterns, by hierarchical clustering as described in Materials and methods. Each row represents relative hybridization intensities of a particular gene across different samples. Colors reflect the magnitude of relative expression of a particular gene across samples. Cluster I, II, and III include genes highly expressed in poly I:C–activated DCs, resting DCs, and TSLP-activated DCs, respectively. Cluster IV includes genes highly expressed in both poly I:C–activated and TSLP-activated DCs. Under culture with different stimuli, expression profiles of the indicated genes (B) and OX40L mRNA expression (C) in DCs were analyzed at the 24-h time point by microarray and RT-PCR, respectively, and surface expression of OX40L on DCs were analyzed at the 48-h time point by flow cytometry (D). OX40L expression on TSLP-DCs were monitored at different time points (E). The staining profile of anti-OX40L mAb and isotype-matched control are shown by the shaded and open areas, respectively. The results of the gene expression profiles (B) are shown as the relative hybridization intensity level by microarray analysis. Accession number of each microarray dataset are available at http://www.ncbi.nih.gov/entrez/query.fcgi?db=gene.

