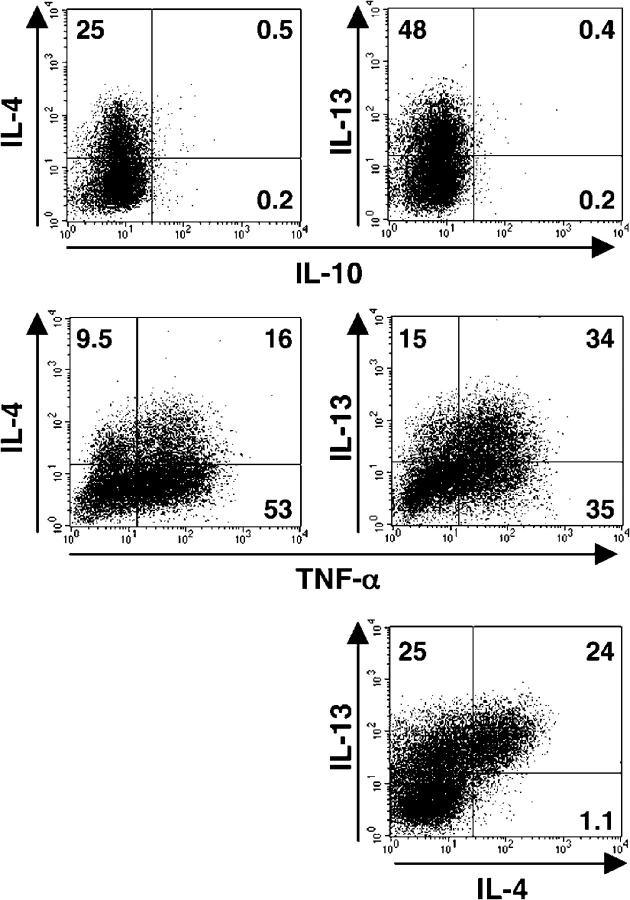
Figure 5.
Th2 cells induced by TSLP-DCs coexpress TNF-α but not IL-10, as analyzed by three-color intracellular cytokine staining. Naive CD4+ T cells were primed with TSLP-DCs for 7 d, and then cytokine production by the CD4+ T cells was analyzed intracellularly by flow cytometry using three patterns of triple-color staining as follows: (a) FITC-labeled anti–TNF-α + PE-labeled anti–IL-4 + APC-labeled anti–IL-10; (b) FITC-labeled anti–TNF-α + PE-labeled anti–IL-13 + APC-labeled anti–IL-10; and (c) FITC-labeled anti–TNF-α + PE-labeled anti–IL-13 + Alexa Fluor 647-labeled anti–IL-4. Percentages of the respective cytokine-producing T cells are indicated in each dot blot profile. Data are from one of three independent experiments.

