
Figure 2.
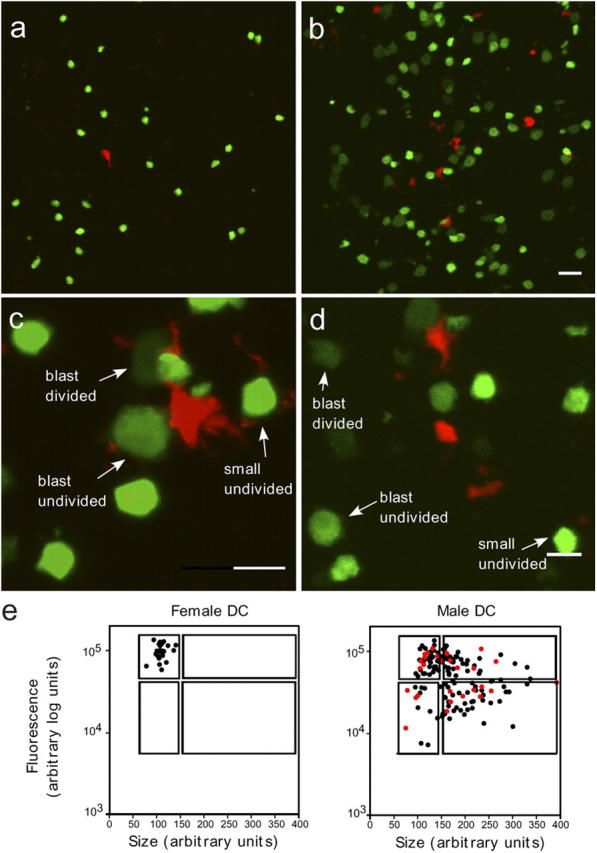
Tracking T cell–DC interactions in the late stage of priming. (a and b) Visualizing the hallmark of T cell activation. Inguinal lymph nodes were harvested and sectioned 48 h after injection of CFSE-labeled Marylin T cells and SNARF-labeled DCs that were derived from female (a) or male (b) mice. Marylin T cells (green); DC (red). Bar, 20 μm. (c) Example of a confocal image (maximum projection of a Z-stack of images) of a lymph node section showing a small undivided T cell, an undivided T cell blast, and a divided T cell blast contacting a male DC (red). Note that undivided T cell blasts appear dimmer when compared with small, undivided T cells because of dilution of the CFSE content in a larger cell volume. Bar, 10 μm. (d) T cells making no apparent contact with Ag-bearing DCs. Bar, 10 μm. (e) The size and the total fluorescent amount of individual T cells was determined as described in the Materials and methods section. Individual Marylin T cells that contacted a labeled DC are shown as red dots, otherwise they are shown as black dots. Regions delimiting four distinct T cell populations based on their size (small cells versus blasts) and division status (undivided versus divided) are shown.