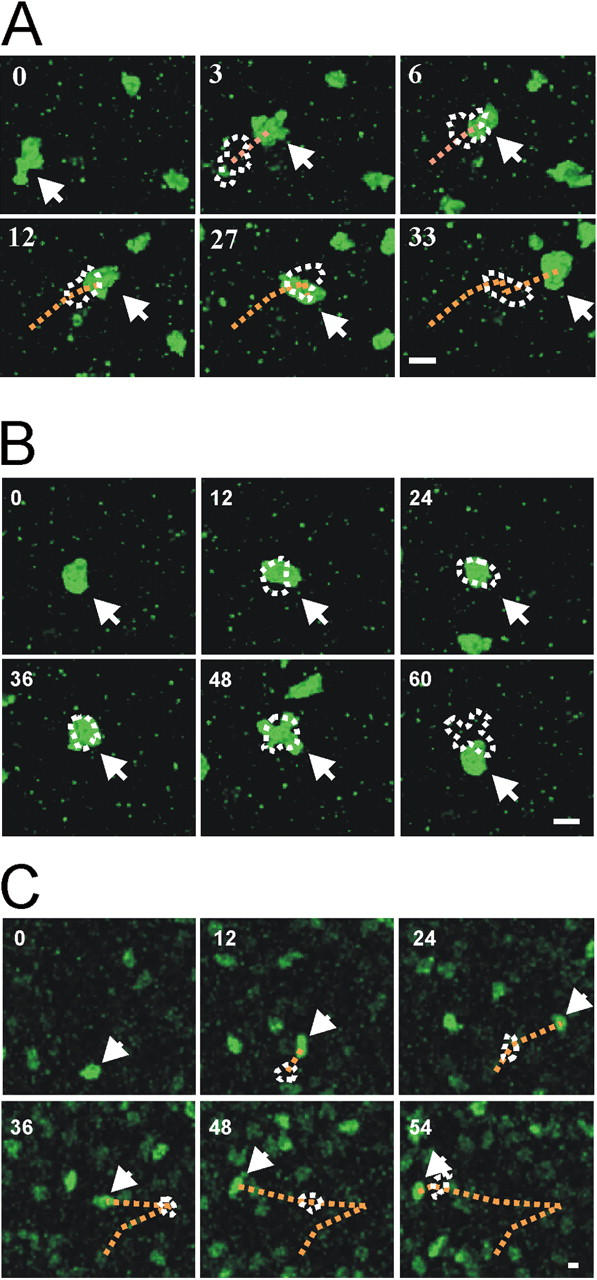
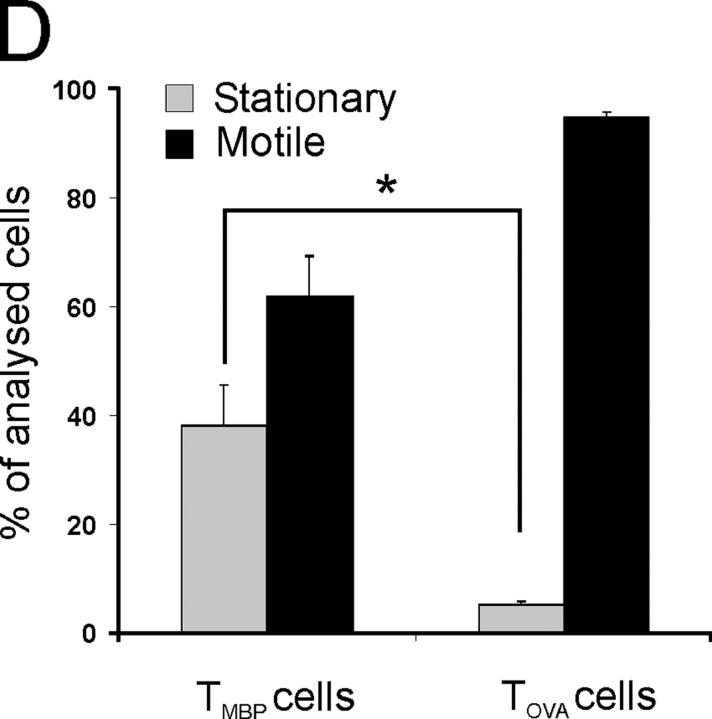
Figure 2.

Motility of auto and control antigen-specific T cells in EAE lesions. (A, B) Two-photon live microscopy of TMBP-GFP cells in acute spinal cord slices. Two types of T cell movements are observed within CNS lesions: “motile” (A) and “stationary” (B) TMBP-GFP cells. Numbers indicate time after start of the analysis (minutes). Dotted lines indicate the trajectories and the cell shape of the preceding pictures. Arrows point to the tracked cells. Representative cells of 10 videos from four independent experiments. Bars, 10 μm. (C) Locomotion of TOVA-GFP cells in living spinal cord slices analyzed by two-photon analysis (4 d after cotransfer of TMBP cells and TOVA-GFP cells). A representative cell of 6 videos from three independent experiments is shown. Bar, 10 μm. (D) Proportion of motile versus stationary MBP- (TMBP cells) and OVA- (TOVA cells) specific T cells in living CNS slices (video microscopy). Motile T cells were defined as cells which migrated >10 μm in 10 min. Cells were grouped as stationary if they moved <10 μm in 10 min. TMBP cells: means ± SD from 6 independent experiments including >700 cells from 11 videos. TOVA cells: means ± SD of 187 cells from 4 videos and three independent experiments. Student's t test, *P < 0.001.

