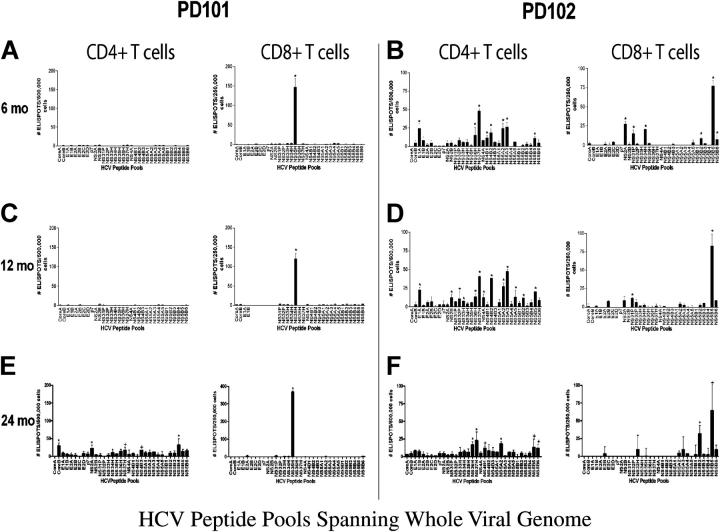
Figure 2.
HCV–genome-wide analysis of CD4+ and CD8+ T cell responses in PD101 and PD102 at 6, 12, and 24 mo after infection. Overlapping 15 mer-peptides (n = 750) were synthesized to span the complete HCV polyprotein derived from HCV-1a (the sequence data are available from GenBank/EMBL/DDBJ under accession no. M62321) and divided into 32 peptide pools. IFN-γ production was detected using an established ELISPOT protocol. CD8+ cells were isolated from PBMCs by magnetic-activated cell sorting magnetic bead separation (Miltenyi Biotec) and the remaining CD4+ others were used. Negative controls in the ELISPOT assay were wells with purified T cells but no peptide (n = 8). After plates were dry, spots were quantified by a Zeiss microscope using KS ELISPOT software. Responses were considered positive if greater than the mean plus three SD of the control wells (DMSO only), if there were at least 10 spots above background, and/or were significant by Student's t test (P < 0.05). Shown are the mean ± SEM. (A and B) CD4+ and CD8+ T cell responses for PD101 and PD102 at 6 mo after infection. The difference in total immune response to the HCV peptides between patients was statistically significant (P = 0.0005, Fisher's two-tail test). (C and D) CD4+ and CD8+ T cell responses for PD101 and PD102 at 12 mo after infection. (E and F) T cell responses for PD101 and PD102 at 24 mo after infection.

