
Figure 2.
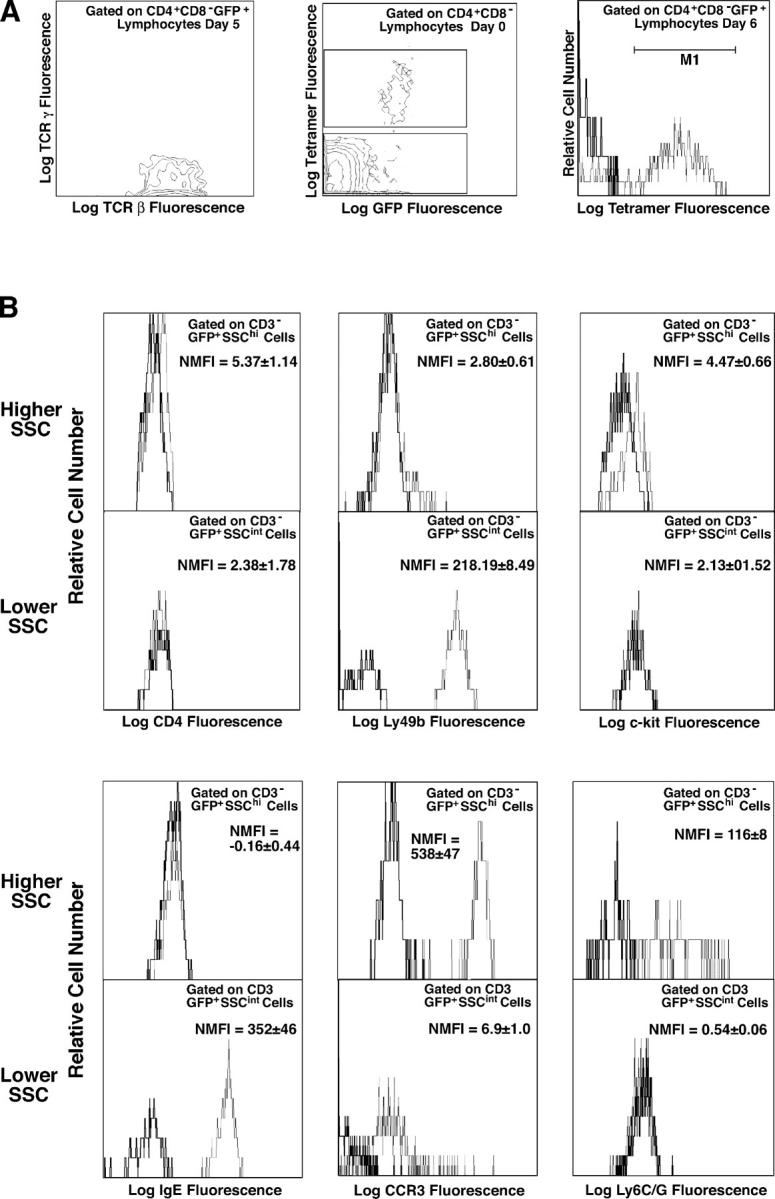
Changes in GFP-expressing spleen cells during the primary response to GaMD in 4get mice. 4get and wild-type mice (4/group) were injected with saline or GaMD and killed 1–14 d later. Spleen cells were stained with combinations of fluorochrome-labeled mAbs to CD3, CD4, CD8, IgE, Ly49b, TCRβ, TCRγ, c-kit, CCR3, and Ly6G/C and with CD1/ α-gal-cer tetramers. Stained cells were analyzed by four-color, dual laser flow cytometry. Histograms show staining with a specific mAb as a fine line; staining with a control mAb or no mAb as a bold line. Gating strategies are shown in Fig. S1. (A) CD4+CD8− spleen cells were analyzed for GFP expression, and GFP+CD4+ cells were analyzed for expression of TCRβ and TCRγ and staining with CD1/α-gal-cer tetramers. The text within the panels indicates gating and time after GaMD immunization. (B) GFP+CD3− spleen cells were analyzed for FSC and side scatter (SSC) of incident light. GFP+CD3− spleen cells with moderate or high SSC were analyzed for expression of surface marker expression. The text within the panels shows normalized median fluorescence intensity of staining (NMFI), defined as (median fluorescence intensity of specifically stained cells) − (median fluorescence intensity of cells not stained with the relevant mAb).