
Figure 1.
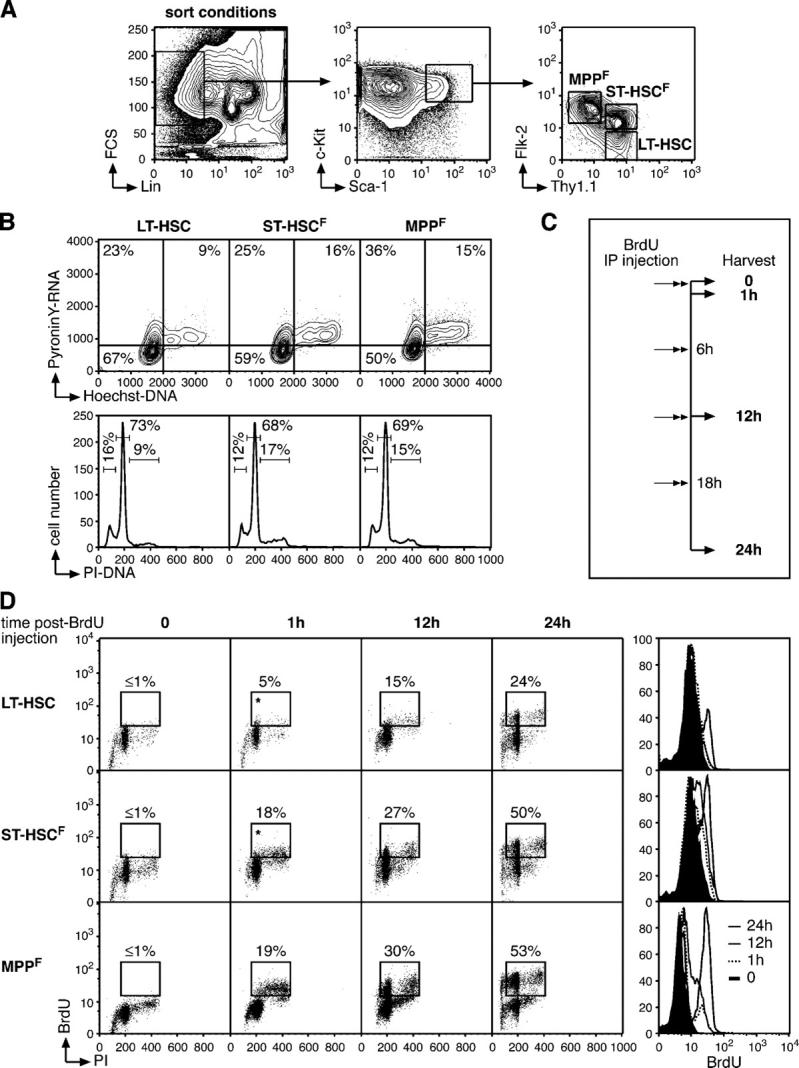
Cell cycle status in the pool of multipotent bone marrow cells. (A) FACS sorting conditions used to purify LT-HSC, ST-HSCF, and MPPF. (B) Cell cycle analyses of purified populations by H/PY (top, contour plot) and PI (bottom, histogram) staining. The percentages of cells in G0 (H2N/PY−), G1 (H2N/PY+), or S-G2/M (H>2N-4N/PY+) and in sub2N (<2N), G0/G1 (=2N), S (>2N and <4N), and/or G2/M (=4N) are indicated. (C) Scheme of the BrdU incorporation experiment. 1 mg BrdU (n = 20 mice/time point) was injected intraperitoneally at the start of the kinetic (t = 0) and every 6 h thereafter, and BM cells were harvested after 1 h (t = 1 h; one injection of BrdU), 12 h (t = 12 h; two injections of BrdU), and 24 h (t = 24 h; four injections of BrdU). (D) Short-term kinetics of BrdU incorporation. At the indicated time after BrdU injection, each population was purified by double FACS sorting, and analyzed by flow cytometry for BrdU/PI staining (dot plots). The percentage of BrdU+ cells is indicated (*, potential background). Histograms (right) indicate the changes over time in BrdU fluorescence intensity.