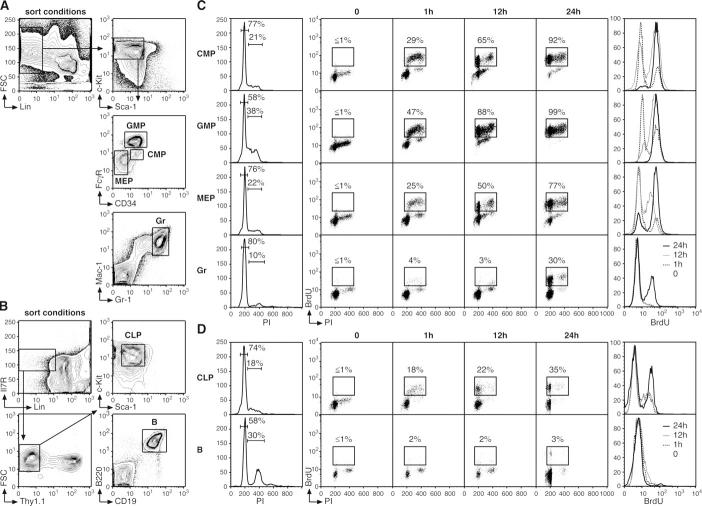
Figure 2.
Cell cycle status in progenitor and mature cell populations. (A and B) FACS sorting conditions used to purify myeloid progenitors (CMP, GMP, and MEP), mature Gr, lymphoid progenitors (CLP), and mature splenic B cells (B). (C and D) Short-term kinetics of BrdU incorporation (n = 5 mice/time point). At the indicated time after BrdU injection, each population was first purified by double FACS sorting and then analyzed by flow cytometry for BrdU/PI staining (dot plots). The percentages of BrdU+ cells are indicated. Histograms on the left represent intracellular PI staining (with the percentage of cells in G0/G1, S, and/or G2/M indicated), and histograms on the right represent the changes over time in BrdU fluorescence intensity.

