
Figure 8.
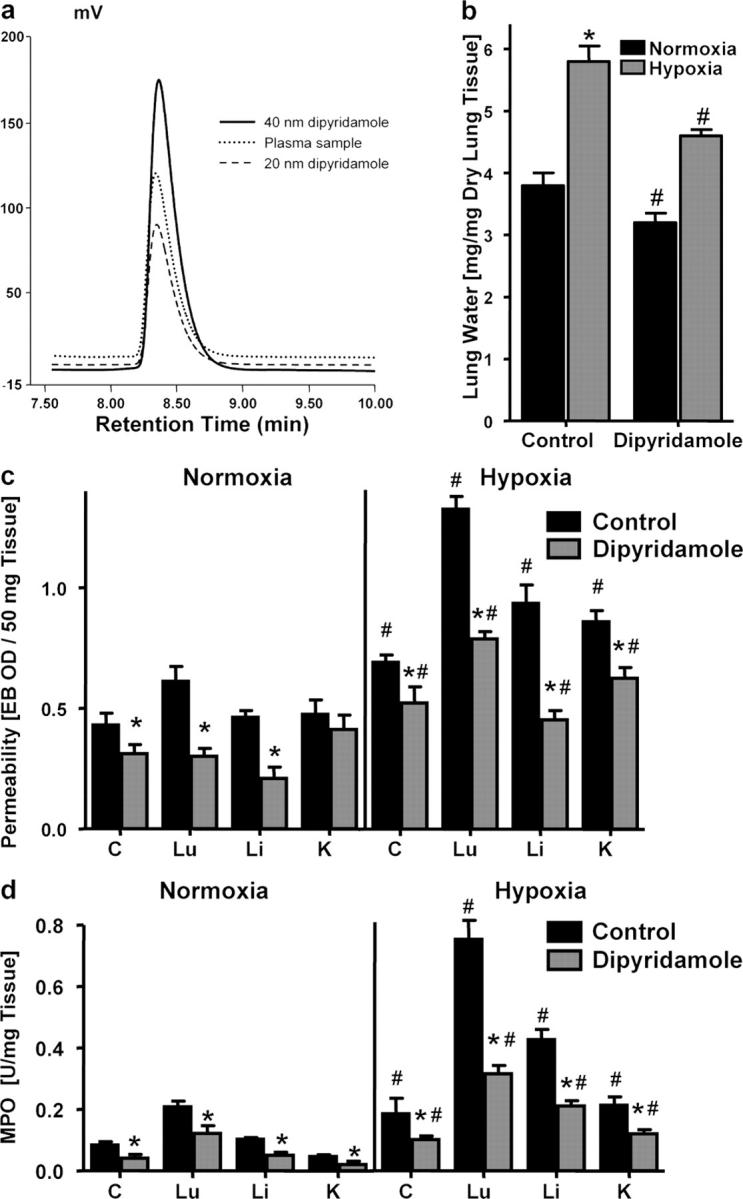
Influence of dipyridamole on pulmonary edema, vascular permeability, and PMN accumulation in vivo. BL/6/129 mice were injected with dipyridamole (10 mg/kg i.p. and 10 mg/kg s.c.) or with PBS, and exposed to normoxia (room air) or normobaric hypoxia (8% O2 and 92% N2) for 4 h. (a) Dipyridamole plasma levels were measured by HPLC and compared with standards of known dipyridamole concentration. Mean plasma dipyridamole concentrations were 33.7 ± 10.2 nM with no differences between treatment groups (P > 0.05). (b) Assessment of lung water content in normoxia (black bars) and hypoxia (gray bars) after dipyridamole or PBS treatment. Data are expressed as mean ± SD mg H2O/mg dry tissue, and are pooled from four animals per condition. *, difference between hypoxia and normoxia (P < 0.025); #, difference between dipyridamole treatment and vehicle control (P < 0.025). (c) Evan's blue vascular permeability. Animals were killed and indicated organs were harvested. Evan's blue concentrations were quantified as described in Materials and methods. Data are expressed as mean ± SD Evan's blue OD/50mg wet tissue, and are pooled from four to six animals per condition, where * indicates differences between dipyridamole/PBS treatment groups (P < 0.025) and # indicates differences between normoxia/hypoxia exposure (P < 0.05). (d) Organ assessment of PMN accumulation by MPO measurements in the indicated organs after 4 h of normoxia/hypoxia exposure (*P < 0.025 compared with PBS, #P < 0.025 compared with normoxia).