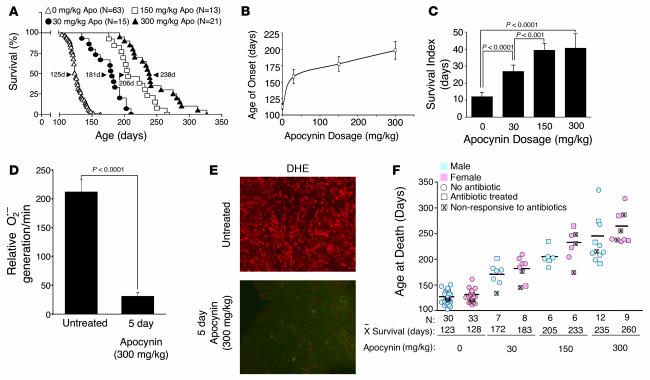
Figure 4. Treatment with the Nox inhibitor apocynin increases lifespan and slows disease progression in mice hemizygous for the SOD1G93A transgene.
(A) Kaplan-Meier survival curve for mice treated with indicated doses of apocynin in their water beginning at 14 days of age. n is shown along with median survival time (arrowhead) for each group. Survival differences were significant in all between-group comparisons (log-rank test). (B) Age of disease onset, as determined by a 10% weight loss from peak body weight, for the various doses of apocynin. (C) Dose affect of apocynin treatment on survival index, measured as time from disease onset (as determined by weight loss) until clinical death. (D) Rate of NADPH-dependent O2•– production in total endomembranes isolated from lumbar spinal cords of end-stage SOD1G93Atransgenic mice (~120 days of age) that were either untreated or treated with apocynin (300 mg/kg) in the drinking water for 5 days prior to harvesting spinal cords (n = 5 per group). (E) DHE fluorescence was assessed in lumbar spinal cord sections from 2 mice evaluated in D. (F) Survival data of male and female mice at the indicated apocynin dose. Mice treated for eye infections with antibiotics are marked as squares; those unsuccessfully treated that died from eye infections are marked by “X” within the square. Circles denote animals that never contracted eye infection. n and mean survival time is indicated for each group. Data in B–D are mean ± SEM.

