
Figure 4.
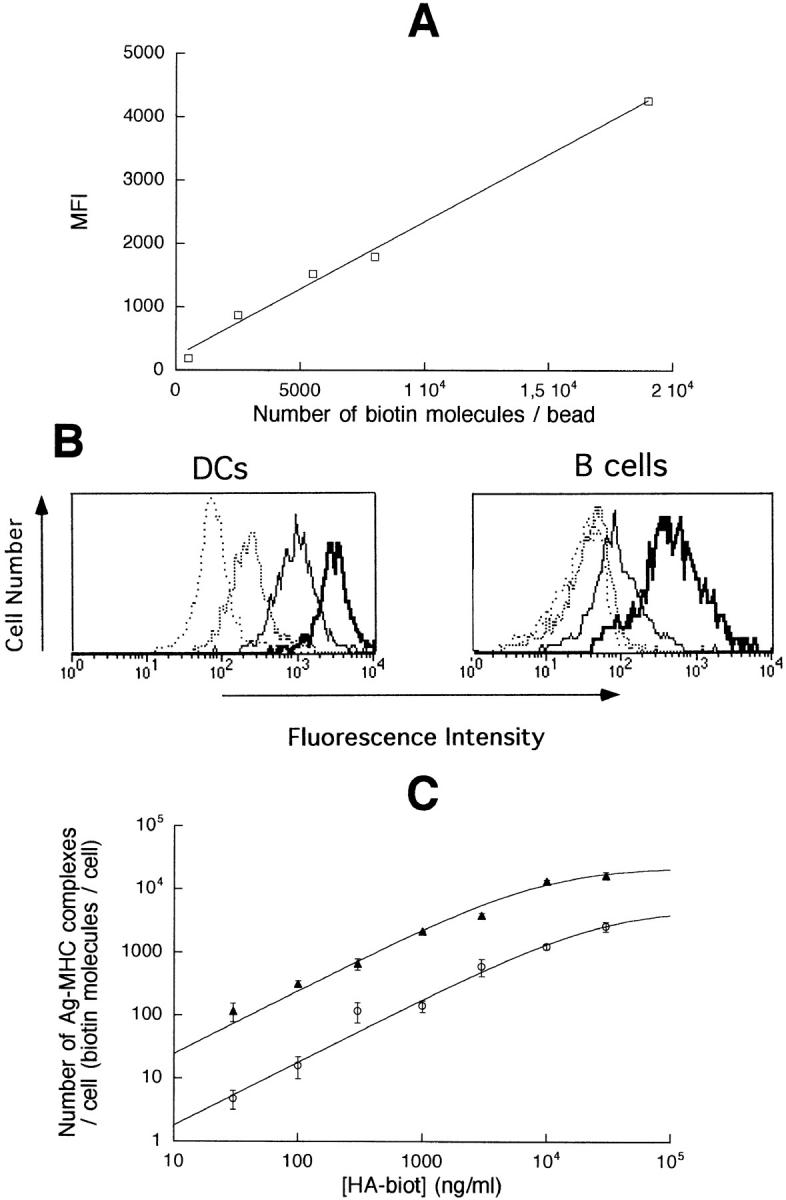
Quantification of the number of Ag molecules present on both APC types. (A) MFI of calibration beads bearing different numbers of biotin molecules. (B) Staining of APCs pulsed with 30 μg/ml HA (negative control, spaced broken line), 0.3 μg/ml HA-biot (broken line), 3 μg/ml HA-biot (solid line), and 30 μg/ml HA-biot (heavy solid line). (C) Number of biotin molecules on B cells (open circles) or DCs ( filled triangles) pulsed with different concentrations of HA-biot. Data are derived from five independent experiments.