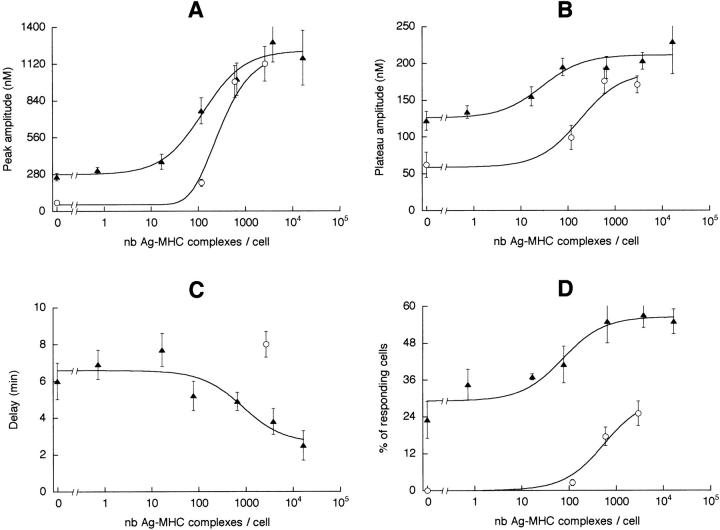
Figure 5.
Characteristics of the T cell Ca2+ responses triggered by different numbers of specific peptide–MHC complexes present on DCs ( filled triangles) or B cells (open circles). (A) Amplitude of the peak. (B) Amplitude of the plateau measured 10 min after the peak. (C) Delay. For B cells, given the large dispersion of the delays, data obtained with Ag concentrations of 3 and 30 μg/ml have been pooled in order to average a sufficient number of measurements. (D) Percentage of responding T cells. nb, Number.

