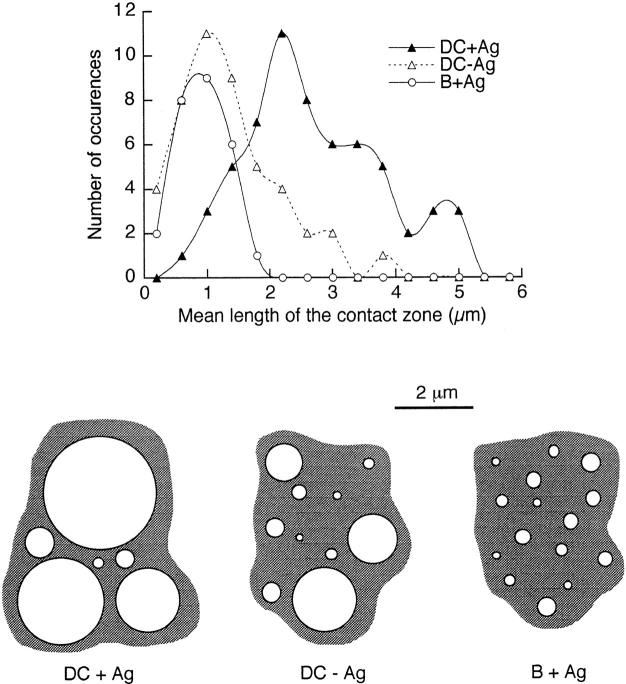
Figure 9.
Analysis of the sizes of contact zones. Top, Distribution of the lengths of the contact zones between T cells and either DCs (with or without 30 μg/ml HA-biot) or B cells (30 μg/ml HA-biot). Bottom, Schematic two-dimensional views of contact zones, based on the average number of elementary contacts per section and on the lengths of the elementary contacts, representative of the experimental means and variabilities.

