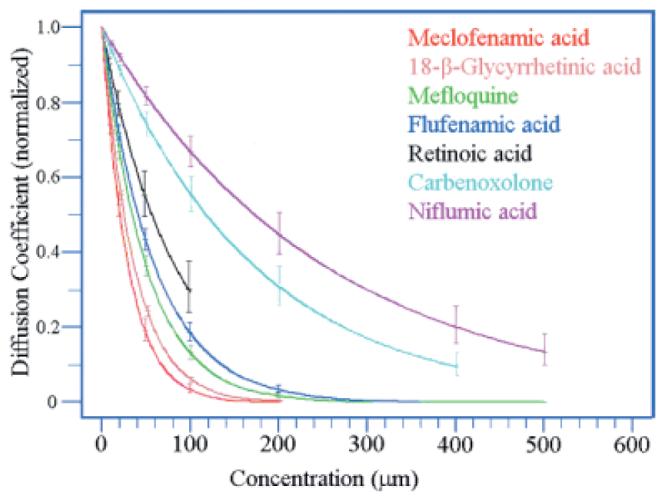
Fig. 2.

Change in diffusion coefficient for Neurobiotin in A-type HCs against the concentration of different gap junction antagonists. All curves were normalized to 1 for the control experiments. Vertical bars show standard deviations. MFA, 18-β-GA and mefloquine were the most potent antagonists. Insufficient data was collected to plot a curve for 2-APB because of its well known effect on store-operated calcium channels. A complete block of dye coupling in A-type HCs could not be obtained with carbenoxolone (400 μM) or niflumic acid (500 μM). Retinoic acid could not be dissolved at a concentration greater than 100 μM without exceeding the limit of 0.5% for DMSO.
