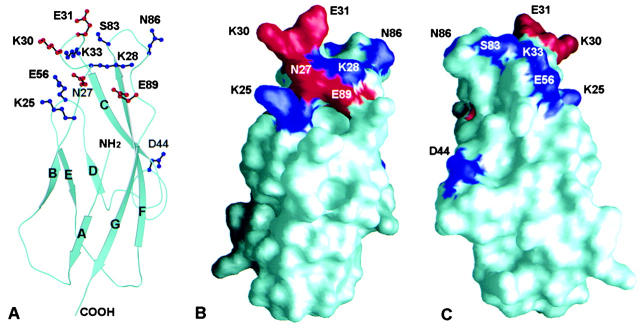
Figure 6.
Ribbon and surface diagrams of domain 1 of E-cadherin demonstrating the location of mutated residues. (A) Ribbon diagram of E-cadherin domain 1. The side chains of residues involved in adhesion to αEβ7 are shown with stick diagrams in red. Mutation of side chains shown in blue did not diminish adhesion to αEβ7 or diminished adhesion to αEβ7 <20%. (B) Surface diagram of E-cadherin domain 1 in the same orientation as A. Residues involved in adhesion to αEβ7 are shown in red, and residues that did not affect adhesion to αEβ7 are shown in blue. (C) Surface diagram of E-cadherin domain 1 rotated ∼180° on a vertical axis from B.

