
Figure 2.
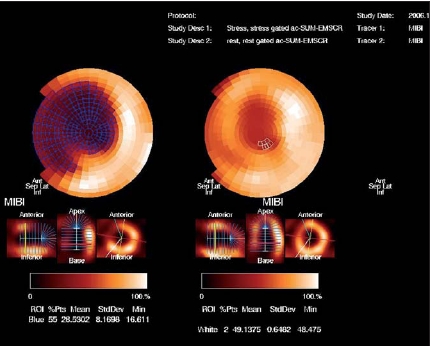
Myocardial SPECT bull’s-eye images summarise three-dimensional data in two dimensions. The blue hatched area in the left plot represents the area at risk before primary coronary intervention (PCI) (48% of the total myocardium). The white hatched area in the right plot demonstrates the final infarction size as percentage of the total myocardium (2%) five days after PCI. Thus, myocardial salvage index can be calculated as area at risk minus final infarction size, divided by the area at risk.