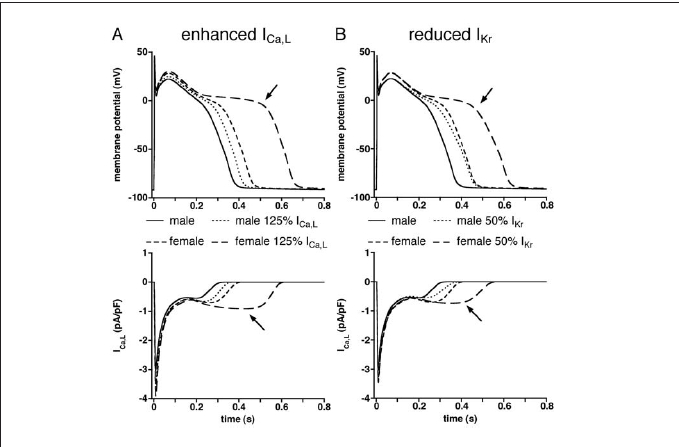
Figure 3.

(A) Action potentials (top) and L-type calcium current (ICa,L, bottom) of midmyocardial cells at 0.1 Hz under control conditions and enhanced ICa,L(125% of control). (B) Action potentials (top) and ICa,L(bottom) of midmyocardial cells at 0.1 Hz under control conditions and reduced rapid delayed rectifier potassium current (IKr, 50% of control). Arrows indicate excessive action potential prolongation (top) due to reactivation of ICa,L(bottom).
