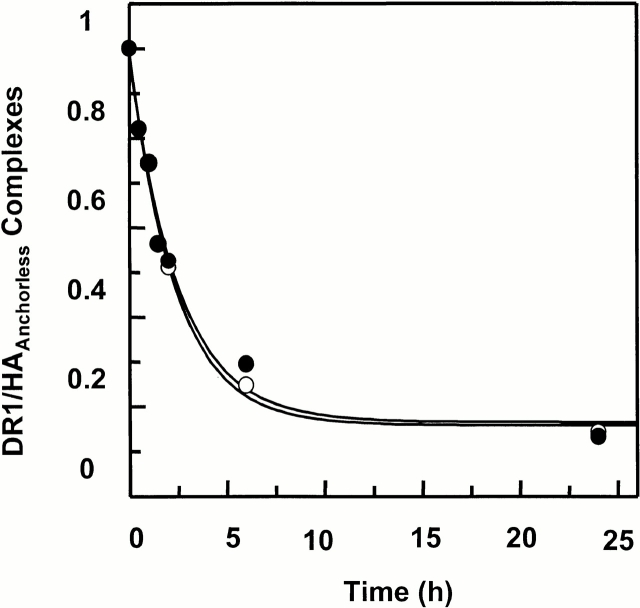
Figure 1.
Peptide dissociation from wt and DR1βG86Y. Dissociation kinetics of wt (○) and sDR1βG86Y (•) complexes. DR1 in complex with FITC-labeled HAAnchorless was produced and separated. The labeled complexes were dissociated in the presence of 100 times molar excess of relevant unlabeled peptides at 37°C in PBS for various times. The fluorescence of the labeled complex before dissociation (f 0) is arbitrarily assigned a value of 1.0. The fluorescence of the labeled complex after dissociation for various times is expressed as a percentage of f 0. The dissociation data are fitted to a single exponential curve that yields t 1/2 of 1.8 ± 0.25 h. The y axis represents arbitrary fluorescence units.

