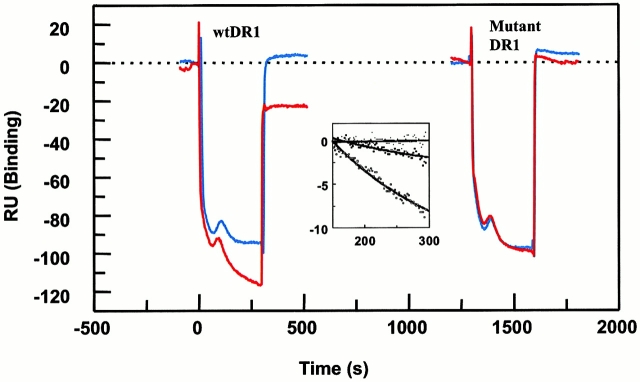
Figure 5.
Dissociation of wt and DR1βG86Y complexes by DM in real time. Peptide–DR1 surfaces were generated as in the legend to Fig. 4, and 9 μM DM was passed through four different peptide–DR1 complex surfaces. For better comparison, all surfaces indicating different RU values were given zero values as the initiation point. DR1βG86Y–HA surface was used as a negative control, as binding was negligible (Fig. 4). The negative sensograms are due to lower salt concentration in DM-containing buffer, and perhaps lack of Tween 20 that was present in the running buffer. Shown are wtDR1–HAAnchorless (red), wtDR1–HA (blue), DR1βG86Y–HAAnchorless (red), and the control mock DR1βG86Y–HA (blue). In the presence of DM, dissociation rates for the wtDR1–HAAnchorless were estimated to be 3.8 × 10⁻³ s−1 (t 1/2 ∼ 3.0 min); for wtDR1–HA, 5.6 × 10⁻⁷ s−1 (t 1/2 ∼ 344 h); and for the DR1βG86Y–HAAnchorless, 8.5 × 10⁻⁵ s−1 (t 1/2 ∼ 2.25 h). Inset, a replot of data after subtraction of the mock DR1βG86Y–HA control surface to provide an easy evaluation of the dissociation rates of the complexes in the presence of DM. One out of two experiments is shown.

