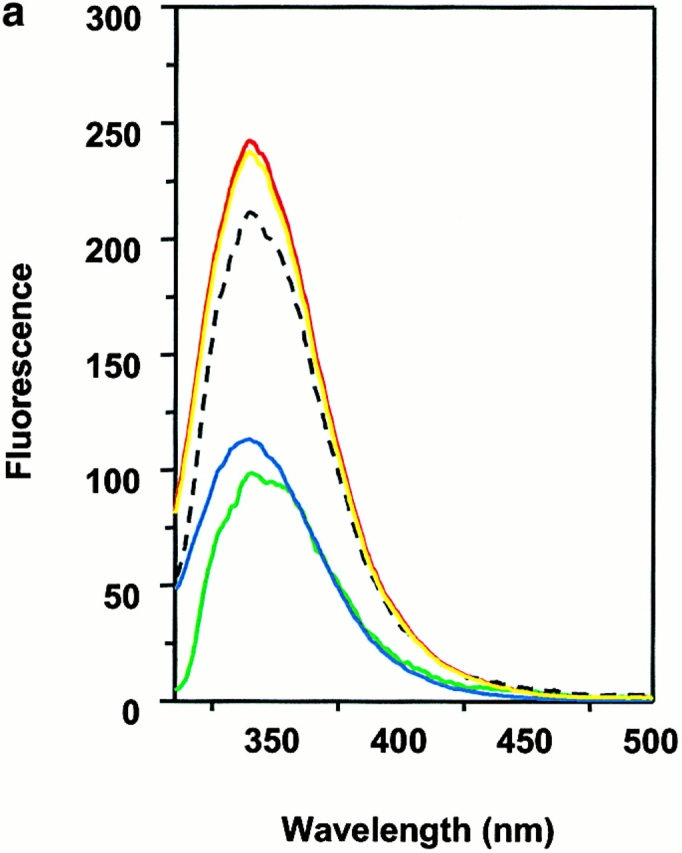
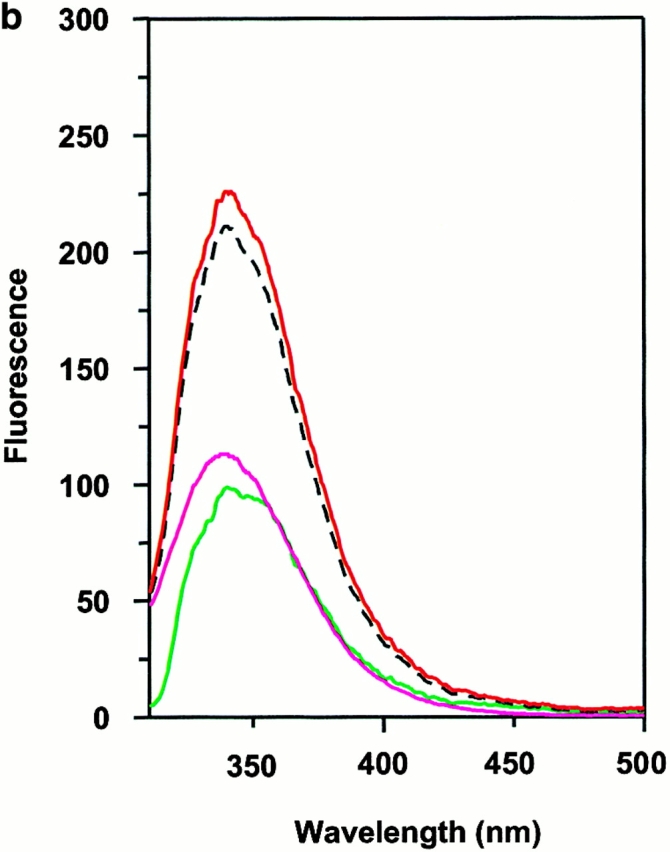
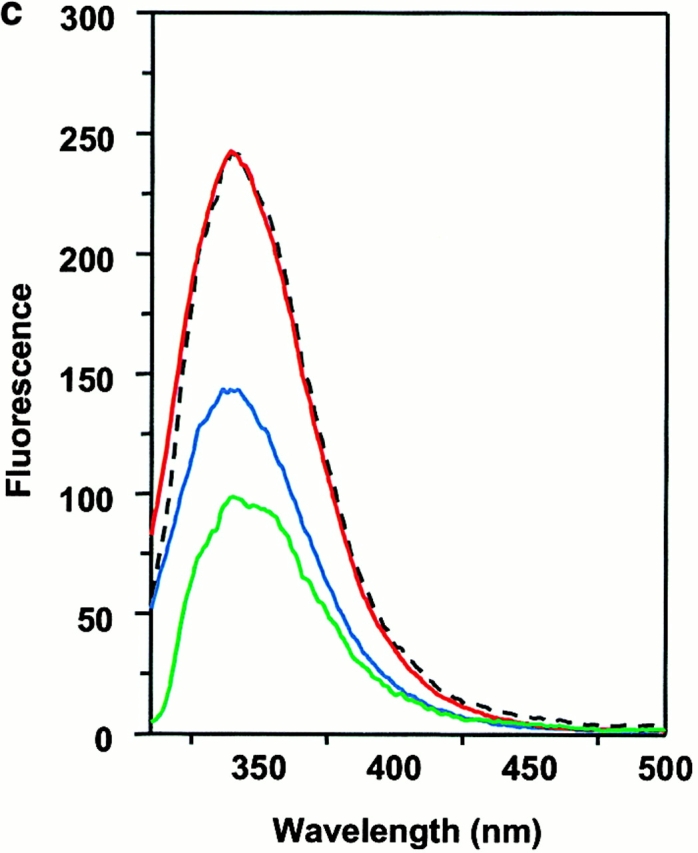
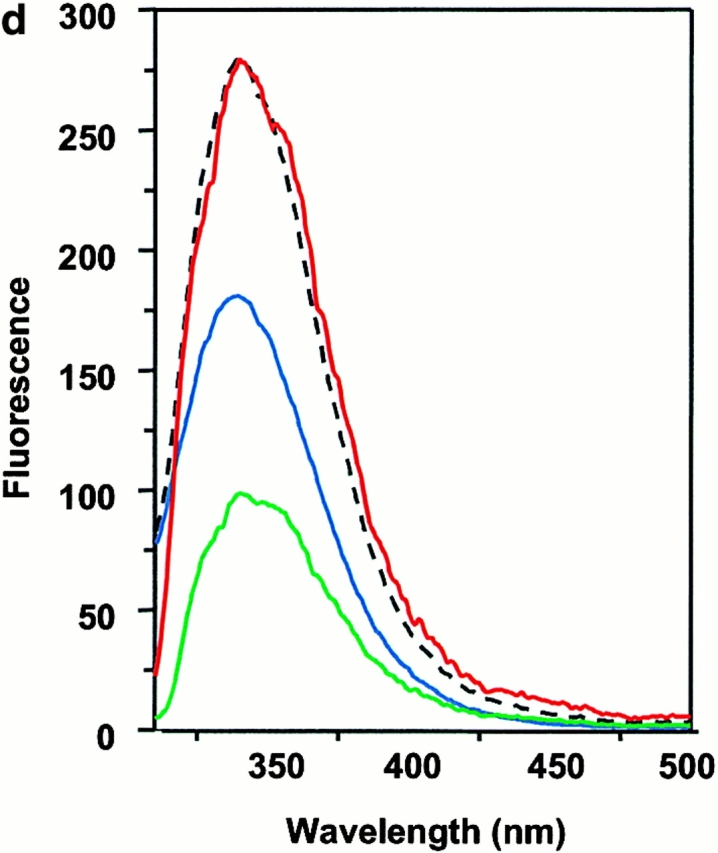
Figure 6.


Interaction between DM and DR1 involves intrinsic tryptophan fluorescence changes. Intrinsic tryptophan fluorescence of DM interacting with empty wtDR1 (a), wtDR1–HAAnchorless (b), empty DR1βG86Y (c), and wtDR1–HA (d) complexes. DM and DR1 molecules (in citrate buffer, pH 6.0) were mixed and tryptophan fluorescence was measured immediately (red) and 1 h after mixing (yellow) for wtDR1 plus DM sample. The intrinsic tryptophans of each sample were excited at 295 nm to minimize the interference of tyrosine fluorescence and the emission spectra were obtained from 310 to 500 nm. Measurements for DM alone (green), DR alone (blue), and the mathematical sum (dashed line) are shown. The average fluorescence intensities from two separate measurements are plotted.
