Figure 6.
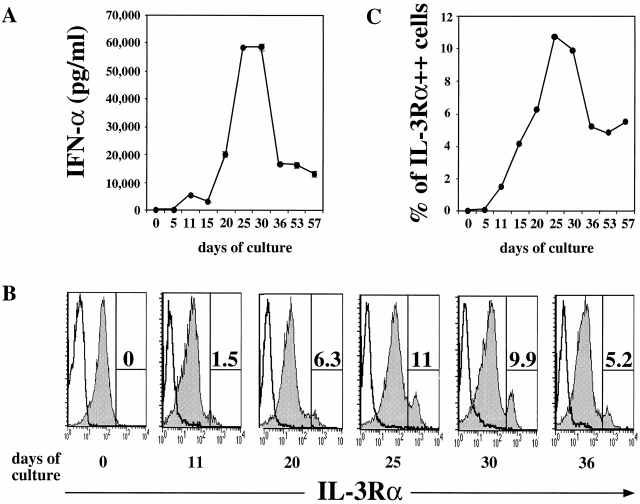
Kinetic analysis on the ability of FLT3 ligand to generate pre-DC2/IPCs from CD34++CD45RA− cells. Sorted CD34++CD45RA− cells were cultured for a period up till 57 d with FLT3 ligand. Every 5 d, cells were harvested and analyzed. (A) Equal numbers of cells were stimulated with HSV-1 (10 PFU/cell) for 24 h. The amount of IFN-α (pg/ml) produced in the supernatants was measured by ELISA. (B) Phenotypical analysis by flow cytometry after staining with CD11c-FITC, IL-3Rα–PE, and HLA-DR–CyChrome. Shaded histograms show the IL-3Rα expression after electronic gating on HLA-DR+CD11c− cells. Open histograms represent staining with an isotype control antibody. (C) Graphical representation of the percentages of IL-3Rα++ cells gated in B.

