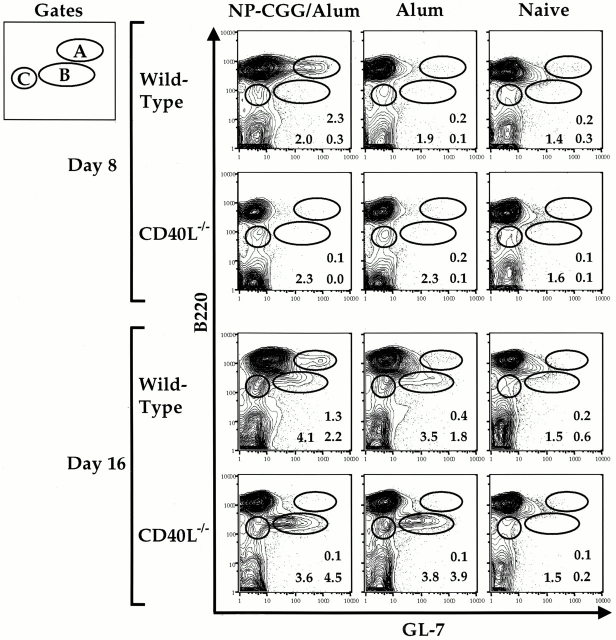
Figure 1.
The appearance of RAG-expressing B220lo cells in the spleen after immunization is independent of antigen and the CD40 pathway. Splenic cells from 10-wk-old CD40L−/− or wt mice immunized intraperitoneally with alum alone, NP-CGG with alum, or PBS were analyzed at days 8 and 16 after injection and analyzed for GL-7 and B220 expression. The percentages of cells out of total live lymphocytes for the gated populations are shown. FACS® plots are shown from representative mice of five experiments where the indicated number of mice was analyzed at days 8 and 16 for each treatment: wt NP-CGG/alum day 8 n = 10, day 16 n = 10; CD40L−/− NP-CGG/alum day 8 n = 2, day 16 n = 2; wt alum day 8 n = 4, day 16 n = 12; CD40L−/− alum day 8 n = 5, day 16 n = 5; naive n = 12, where wt mice were either 129 or RAG2–GFP. The mean and standard deviation for the percentages of subsets out of total live lymphocytes observed on day 8 and day 16 are as follows: at day 8, wt NP-CGG/alum mice exhibited 1.8 ± 0.8% B220hiGL-7++ cells (gate A) compared with percentage values of 0.12 and 0.16 for the CD40L−/− mice immunized with NP-CGG/alum, 0.54 ± 0.2 for wt alum, 0.14 ± 0.05 for CD40L−/− alum, and 0.43 ± 0.3 for naive mice; at day 16, the B220loGL-7+ subset (gate B) was observed at percentage values of 6.5 ± 6.1 for wt NP-CGG/alum, percentage values of 0.77 and 12 for the CD40L−/− mice immunized with NP-CGG/alum, 3.0 ± 2.8 for wt alum, 6.3 ± 2.3 for CD40L−/− alum, and 0.5 ± 0.5 for naive mice; at day 16, the B220loGL-7− subset (gate C) was observed at percentage values of 8.0 ± 5 for wt NP-CGG/alum, percentage values of 5.9 and 9.6 for the CD40L−/− mice immunized with NP-CGG/alum, 4.8 ± 1.6 for wt alum, 6.4 ± 2.4 for CD40L−/− alum, and 2.9 ± 1.3 for naive mice.

