
Figure 3.
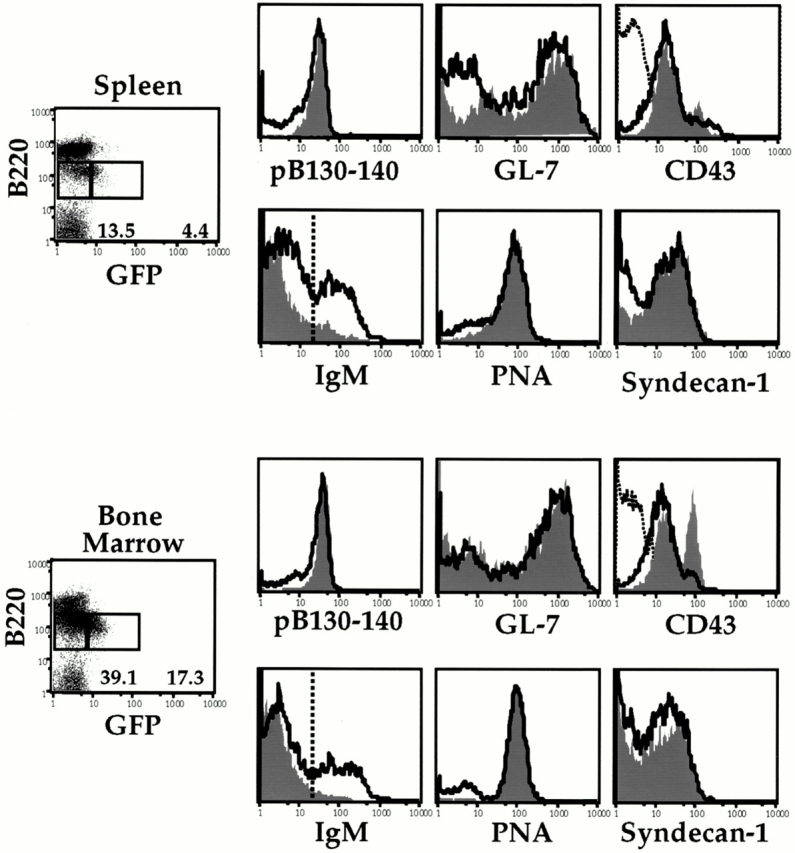
B220lo cells present in immunized spleen resemble pro/pre/immature B cells. Splenic and BM RAG2–GFP+ and RAG2–GFP− cells from NP-CGG/alum–immunized (intraperitoneally) mice at day 16 were analyzed for cell surface expression by staining for pB130-140, GL-7, CD43, IgM, PNA, syndecan-1, and B220. Histograms depicting the expression of the various cell surface markers generated from the RAG2–GFP+ gated cells (shaded) are overlayed with histograms generated from RAG2–GFP− gated cells (line). In the CD43 histogram panels, B220hi gated cells were used to generate CD43− histograms as a reference (dotted line). Percentages of RAG2–GFP+ and RAG2–GFP− cells out of total live B lymphocytes are shown. In the spleen, 10% of GFP+ cells were IgM+ and 32% of GFP− cells were IgM+. In the BM, 5% of GFP+ cells were IgM+ and 30% of GFP− cells were IgM+. Gates are as indicated on the IgM histogram panels. FACS® plots are shown from representative mice of two experiments representing eight RAG2–GFP immunized mice and four 129 naive mice. BM RAG2–GFP+ and RAG2–GFP populations exhibit the same respective cell surface phenotype regardless of whether cells were analyzed from immunized or naive mice. BM or splenic GFP+ and GFP− cells from mice immunized with alum alone exhibited a similar phenotype as the data shown.