
Figure 1.
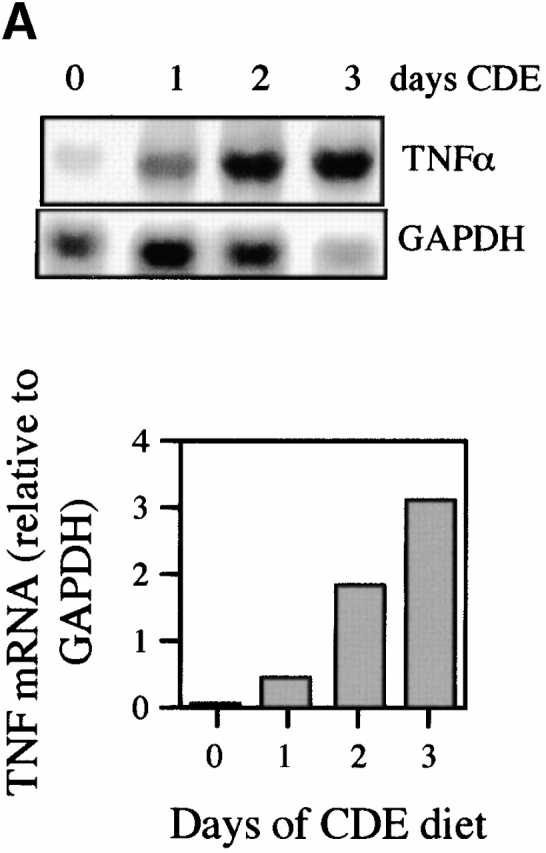


Increased expression of TNF-α during CDE diet feeding. TNF-α levels were detected by ribonuclease protection assay and quantified by densitometry relative to GAPDH. TNF levels increased during the first few days of the CDE diet (A). A peak in TNF-α expression in CDE samples (gray bars) compared with WT (white bars) was seen at 2 wk (B). Repeat experiments show the result illustrated in the representative autoradiograph to be reproducible (bars represent mean ± SEM, n = 6). Analysis of TNF-α mRNA in purified cell types showed expression in oval (OC) and inflammatory (IC) cells but not in hepatocytes (H) (C).