
Figure 3.
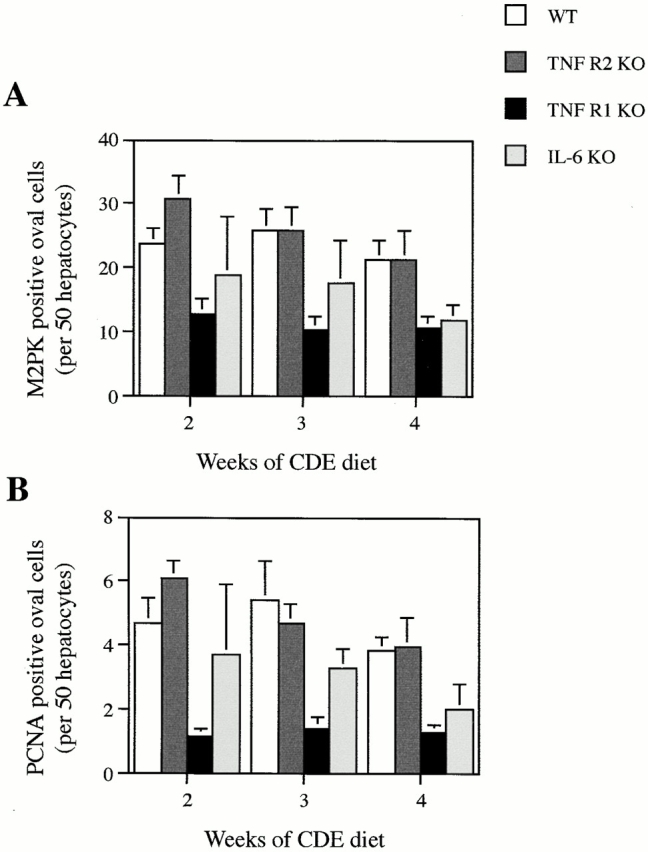
Quantitation of oval cell numbers in WT and KO mice. Livers were stained using either M2PK (for specific detection of oval cells) or PCNA (to detect proliferating cells), and positive oval cells were scored and normalized to hepatocyte number in the same area. Results shown are WT (white bars), TNF R2 KO (dark gray bars), TNF R1 KO (black bars), and IL-6 KO (light gray bars). Results are expressed as mean ± SEM, n = 5 (WT, TNF R1 KO, TNF R2 KO) or mean + range, n = 2 (IL-6 KO). Both M2PK- (A) and PCNA-based (B) oval cell counts reflect the pattern of oval cell response documented in Fig. 2.