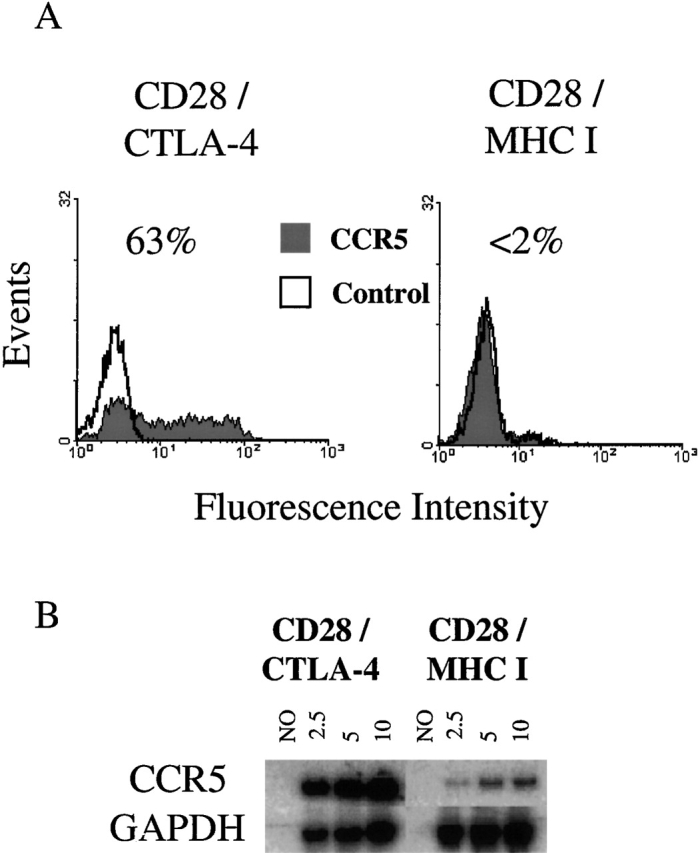
Figure 2.

CCR5 levels in CD4 T cells stimulated with anti-CD3/28/CTLA-4 immunobeads. CD4 T cells were isolated and stimulated with beads containing a 3:7 ratio of anti-CD28 to anti–CTLA-4 or anti–MHC class I beads for 6 d. (A) Cytofluorometric analysis of CCR5 (red) or isotype control (open) fluorescence. Values of 2% or less are considered background. (B) RT-PCR analysis of CCR5 mRNA levels. RNA was isolated from CD4 T cells stimulated with 3:7 CD28/CTLA-4 and 3:7 CD28/MHC I beads, and cDNA was synthesized and diluted to the optimal level (1:3 for CCR5 and 1:3,000 for GAPDH). 2.5, 5, or 10 μl of the RT product was used in the subsequent PCR and liquid hybridization reaction to demonstrate that the assay was performed within the linear response range. NO, the amplification of a cDNA reaction in a sample from which the RT was omitted. Data shown are representative of four experiments.
