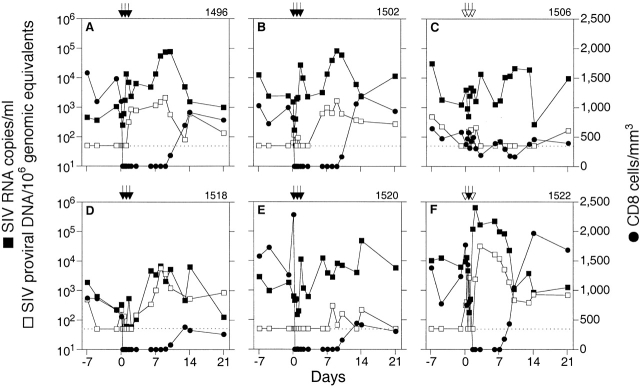
Figure 3.
Changes in viral load after in vivo depletion of CD8+ T cells. SIV RNA in plasma and SIV proviral DNA in PBMCs were determined for each sample in duplicate by real-time PCR and differential amplification. SIV proviral DNA data were normalized per 106 genomic equivalents measured of the single-copy gene CCR5. Data are shown for CD8+ T cells (•), SIVmac239Δnef RNA (▪), and SIVmac239Δnef proviral DNA (□). SIVmac251 RNA or DNA were not detectable. Administrations of OKT8F (black arrows) or the control antibody P1.17 (white arrows) were performed on days 0, 1, and 2. The limit of sensitivity of the viral load assay is indicated by the dotted line.

