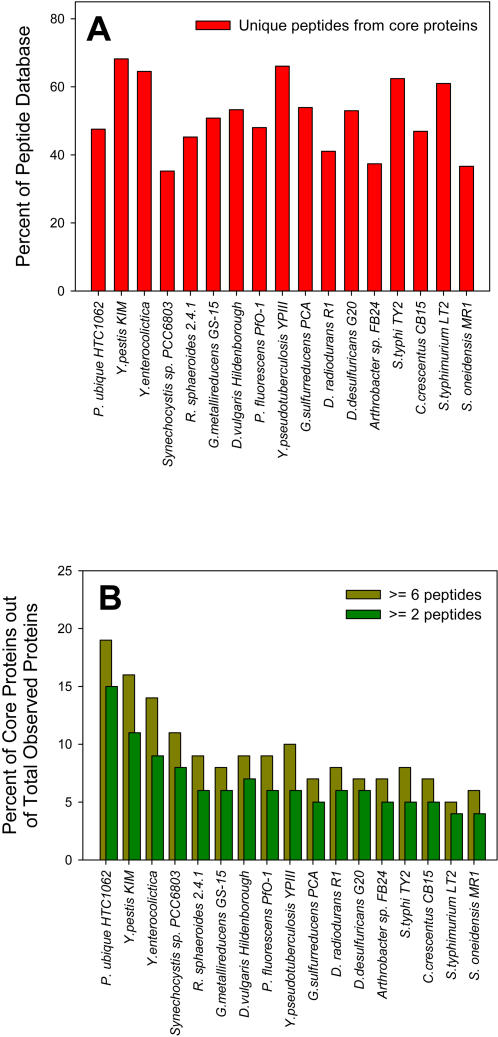
Figure 3. The analysis of peptides and their corresponding proteins identified within each bacterium's database of observed peptides.
Organisms on the x-axis are sorted by proteome size (increasing). A) The percent of each proteome composed of peptides identifying core proteins predicted by the core genome. A significant percentage of each proteome was composed of these peptides, which suggests that they are regularly observed. B) The percentage of core proteins observed out of the total number of proteins identified by peptides within each proteome. As the number of peptides required to identify a protein increased (from 2 to 6 peptides), the percentage of core proteins out of the total number of observed proteins also increased.

