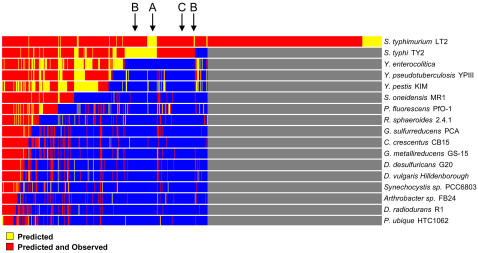
Figure 5. Predicted and observed orthologs shown relative to predicted and observed proteins in S. typhimurium.
Approximately 50% of predicted proteins in S. typhimurium exhibited orthology (blue area) to at least one other bacterium in the set of bacteria. As expected, S. typhi had the greatest degree of predicted and observed orthology to S. typhimurium.. Certain regions of orthology are unique to the two serovars and include A) orthologs predicted only, B) orthologs predicted in both serovars, but observed in only one, and C) orthologs predicted and observed in both serovars. Categories A and B highlight proteins for future investigation as potential therapeutic targets.

