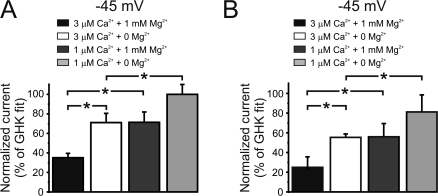
Figure 4.
Comparison between native and theoretical IKCa and SKCa currents. IKCa (A) and SKCa (B) currents at −45 mV in cells dialyzed with different pipette solutions normalized to the GHK predictions depicted in Fig. 3. For 1 mM Mg2+ and 3 μM Ca2+ (% of GHK fit): IKCa (35 ± 4) and SKCa (25 ± 10); for 0 Mg2+ and 1 μM Ca2+ (mM): IKCa (71 ± 9) and SKCa (55 ± 5); for 1 mM Mg2+ and 3 μM Ca2+ (mM): IKCa (71 ± 11) and SKCa (56 ± 13); for 0 Mg2+ and 1 μM Ca2+ (mM): IKCa (99 ± 10) and SKCa (80 ± 17). *, P < 0.05.

