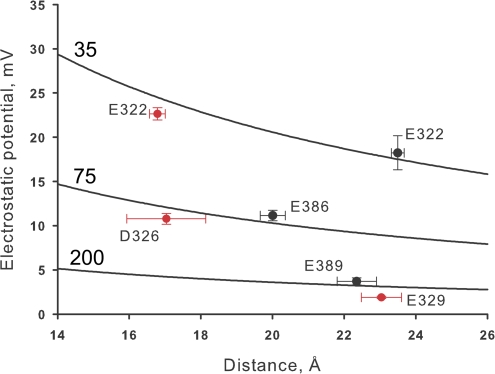
Figure 12.
Calculated electrostatic potentials are not a simple functions of distance. Electrostatic potentials are plotted in the vertical axis and the distances to the carboxyl group in the horizontal axis. Electrostatic potentials calculated at the internal end of the selectivity filter are represented with black symbols, the coordinates of this site are x = 0, y = 0, z = −2 Å. Electrostatic potentials calculated at the internal end of the selectivity filter (x = 0, y = 0, z = 17) are represented with red symbols. Error bars on the horizontal axis are the distance ranges read from the radial distribution function computed of 100 snapshots of an MD simulation where the protein backbone atoms were under a 5 kcal per angstrom square harmonic restraint. The three lines drawn represent the electrostatic potential as a function of distance calculated using 35, 75, or 200 as dielectric constants.

