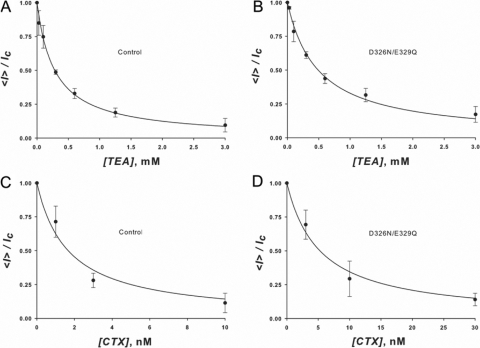
Figure 7.
(A and B) TEA+ blockade. The figures are plots of the macroscopic current measured at +70 mV on outside out patches at various outside TEA+ concentrations normalized by the current measured in the absence of TEA+. (A) Control wt BK channels. (B) D326N/E329Q BK mutant channels. Data points represent the average and standard deviation of the normalized current measured in three membranes. TEA+ dissociation constants are 1.9 ± 0.3 × 10⁻⁴ M for the control channels and 4.9 ± 0.3 × 10⁻⁴ M for the double mutant channels. From the effect of the mutation on the TEA+ dissociation a constant surface potential difference of 13 ± 2 mV was calculated using Eq. 1. (C and D) CTX blockade. The figures are plots of the relative macroscopic current measured on outside out patches at various outside CTX concentrations normalized by the current measured in the absence of the blocker. (C) Control channels. (D) D326N/E329Q BK mutant channels. Data points represent the average and standard deviation of the normalized current measured in three membranes. CTX dissociation constants are 1.7 ± 0.3 × 10⁻⁹ M for the control channels and 5.3 ± 0.3 × 10⁻⁹ M for the double mutant channels. From the effect of the mutation on the CTX dissociation constant, a surface potential difference can be calculated using Eq. 1. Δφ' is 28.8 mV for z = 1 and 4.8 mV for z = 6. Assuming that the actual surface potential difference is that measured using TEA+, the apparent z of CTX is 2.1.

