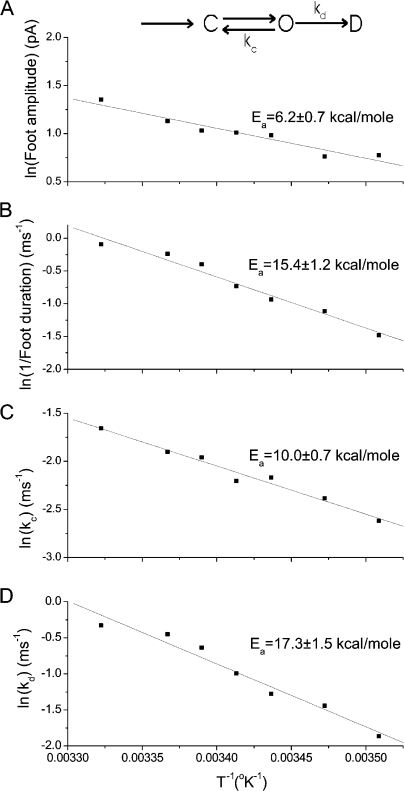
Figure 6.
Temperature dependence of fusion pores. The kinetic scheme at the top indicates the formation of a closed fusion pore, C, and the transition to the open state, O. The open state can close with rate kc or enter the dilating phase, D, with rate kd. Arrhenius plots are presented for (A) foot amplitude, (B) 1/(mean foot duration), (C) kc, and (D) kd. kc and kd were determined from the mean lifetime (Fig. 6 B) and fraction of large kiss-and-run events (Fig. 5 C) as described in the text and in Wang et al. (2006).

