Figure 8.
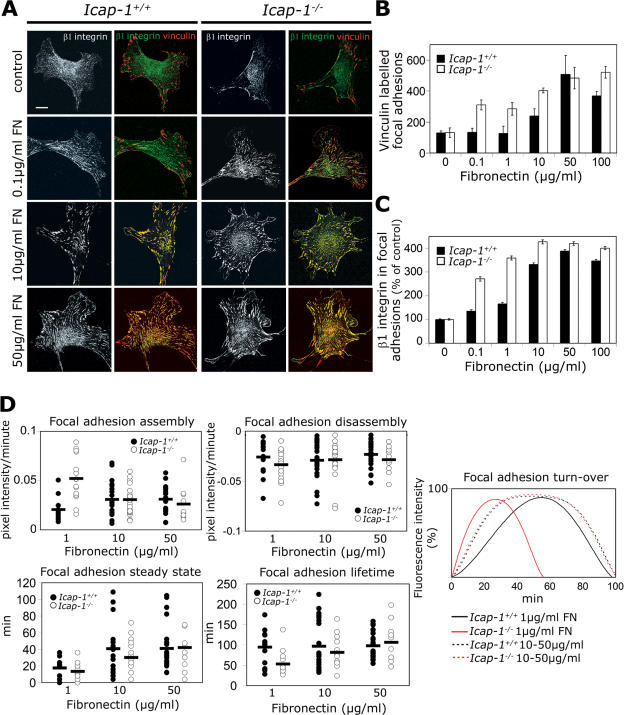
ICAP-1 loss decreases matrix density sensing. (A) Icap-1+/+ and Icap-1 −/− MEF cells were allowed to spread on glass coverslips coated or not coated (control) with increased FN concentrations in FCS-containing medium and were immunostained to visualize vinculin and β1 integrin (9EG7). Images were taken with a confocal microscope. (B and C) The number of vinculin-stained FAs/cell (B) and the MFI of β1-integrin staining within FAs (C) were measured for each FN concentration. 50 cells were analyzed for each experimental condition, and error bars indicate SD. (D) EGFP-paxillin–expressing Icap-1+/+ and Icap-1 −/− MEF cells were spread on FN at concentrations ranging from 1 to 50 μg/ml and were recorded by time-lapse video microscopy at 4-min intervals for 6 h. FA turnover was quantified as previously described in Fig. 4: the rates of FA assembly and disassembly were determined as well as the duration of the steady state and total lifetime at three different FN densities (1, 10, and 50 μg/ml). Data from at least 20 cells per experimental condition were recorded. Each point represents a single FA, and the horizontal bars show the means of all FAs. These parameters were compiled in a schematic model of FA turnover in Icap-1+/+ and Icap-1 −/− cells. Adhesion site turnover displays different behaviors depending on matrix density. Note the appearance of a steady-state plateau in both cell types at high FN concentrations without any change in FA lifetime. Error bars represent SD. Bar, 20 μm.

