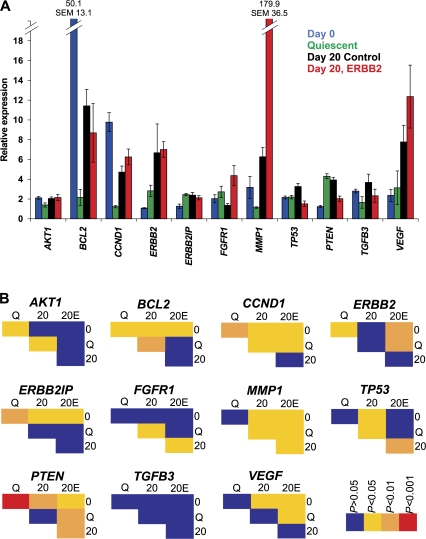
Figure 6.
Quantitative RT-PCR analysis during differentiation of MECs. (A) Total RNA was harvested from cells grown as standard 2D cultures (Day 0), quiescent 2D cultures (Quiescent), and cultures grown for 20 d under 3D growth conditions with 10 d of constitutive activation of ErbB2 (Day 20, ErbB2) or without activation (Day 20 control). Values represent means ± SEM from three independent experiments. Expression levels are normalized to cyclophilin. (B) Pairwise comparisons for expression using a t test.

